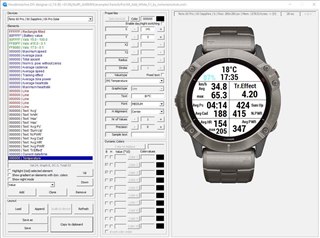
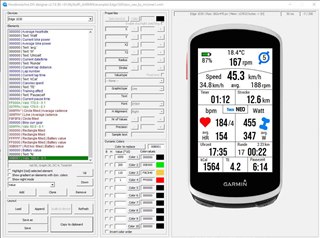
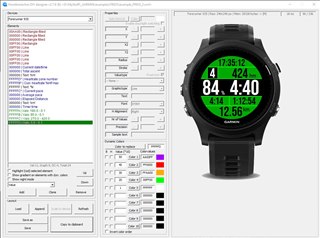
HMs DIY #1-6

Store Link

Because I want to keep this datafield and the app free for use I would be very grateful about a small donation to PayPal

A detailed description of how to use it can be found here: 

HMs_DIY_GUIDANCE.pdf
HMs_DIY_ANLEITUNG.pdf

Thanks very much to mcinner1 for putting so much time into this documentation!

Designer download

You can contribute on my github page.
You can upload your layout so others can use it as well.
Also any changes to the fonts.txt can be updated there as well.

Garmin_HMsDIY

=======================================================================
RELEASE NOTES
=======================================================================
-----------------------------------------------------------------------
3.6.2
* switched to new SDK 7.2.1
* added devices: Approach S7 42mm, Descent Mk3 43mm /Mk3i 43mm, Descent Mk3i 51mm, Edge 1050, epix Pro Gen2 42mm, epix Pro Gen2 47mm / quatix 7 pro, epix Pro Gen2 51mm / D2 mach 1 pro / tactix 7
Fenix 7 Pro, Fenix 7 Pro Solar, Fenix 7S Pro, Fenix 7X Pro, Fenix 7xPro Solar, Forerunner 165, Forerunner 165M, Venu 3, Venu 3S, Vivoactive 5
-----------------------------------------------------------------------
3.5.1
* switched to new SDK 4.2.4
* added devices: FR265, FR265S, FR965, GPSMAP 67/67i, Marq (Gen 2), Marq (Gen 2) Aviator, EDGE 540, EDGE 840, Instinct 2x Solar
* added two new font types GLANCE, GLANCENR (only available if device supports it!)

for full releasenotes see: releasenotes.txt
=======================================================================
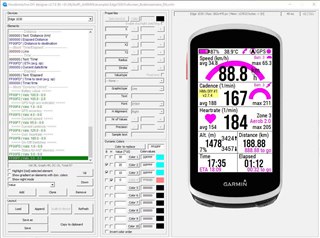
 

  • I have to apologize for beeing sloppy with my first video: it was taken from Edge 1030 PLUS!
    With that device (faster CPU) your layout skips only one second within 10 seconds and changing cadence happens simultaneosly with Garmin data and DIY.

    I did the test now with my "old" Edge 1030 and it behaves quite differently:
    - 4 seconds skip within 10 second
    - no simultaneosly change of cadence
    (Note: I have set timer data instead of speed for better watching)

  • Thanks for testing again. Behavior now looks like on mine. Perhaps I will reduce the layout a bit.

    If there would be a chance to have some values not updated on every cycle but only every 3s or 10s to reduce calculation time that would be very helpful.

  • Hi

    I am afraid thats not possible. Updating the value does not need much time, its the drawing which takes that much time. And if I dont draw every value on every refresh it would just disappear... 

  • What would have then most effect to reduce calculation time? Reduce graphical elements or just number of elements? Would it help to reduce more the (H) values or doesn't it matter because the calculation isn't the issue?

  • Hi

    Just the number of elements does matter. Keep in mind that a line graph consists of many lines takes much time to draw. So the graphs need the most time to draw. 

  • Thanks a lot for adding active minutes values!
    Unfortunately I can't test it because of snow and icy paths ... Unamused

  • I tried some test cases to identify a little bit more, what is influencing the performance. I have to say, that I didn't find out much, but for those who are interested I can share the results. I thought that this ms value in HM Designer would have something to do with performance but not in every case.

    All tests performed on my Edge 1030. I did the test without actual driving or any sensors connected. So it might be worse in real life conditions. I started an activity waited about 1 minute and then counted for 30 seconds how often timer value didn't display a second. For graphic values I just duplicated the items, so they were at the same place, but because I don't think there will be any optimization or test if something is overlapping, I think it shouldn't matter.

    Test cases

    • 20 values (H) displayed, ~24ms in Designer, no drops
    • 50 values (H) displayed, ~48ms in Designer, 5 drops
    • 200 static lines, 100 static circles, 100 static rectangles, ~30-31 ms in Designer, no drops
    • 500 static elements (300 static texts), ~310 ms in Designer, 3 drops
    • my latest layout (posted before) ~68 ms in Designer, 10 drops
    • MC_Inner_Gear (from examples) ~ 46 ms in Designer, 3 drops
    • older layout including 5 graphs, ~ 110 ms in Designer, 11 drops
    • original Garmin 10 field layout while graph layout was running in background, 4 drops

  • Hi

    The time shown in the designer is only the time which the designer needs to draw all elements. It has nothing to do with the datafield itself.

    To sum it up, graphs take much longer than the other elements. The rest takes pretty much the same time to draw.

  • Yesterday I did another tour and again I had the difference between lap values and average values, but this time I noticed, why this happened. It seems that it was my fault, because I didn't open the datafield before starting the activity. I was on the map screen and opened later in the ride first time the datafield. At this position lap started because probably those values are calculated in your datafield while average values comes from API.

    I would like to add one more feature request. I noticed that in API 3.2 weather information should be available. I would like to have values windBearing and windSpeed and if possible wind direction relative to own orientation (windBearing - headingDirection).

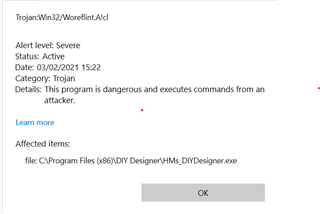
  • Apologies for revisiting an old topic. After previously not experiencing any of the Malware detections mentioned above. Following a Window Defender update today it triggered the following detection

    I'm sure it's nothing to worry about. I just wanted to let you know