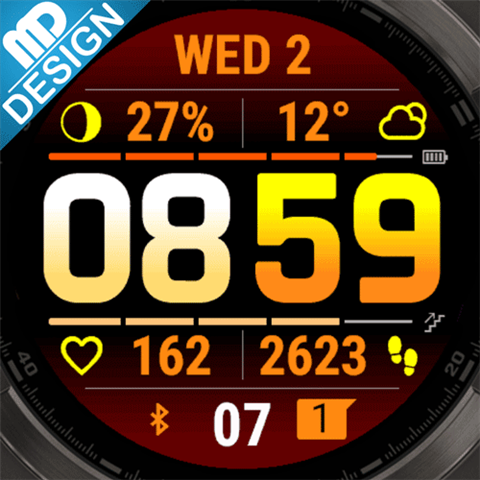
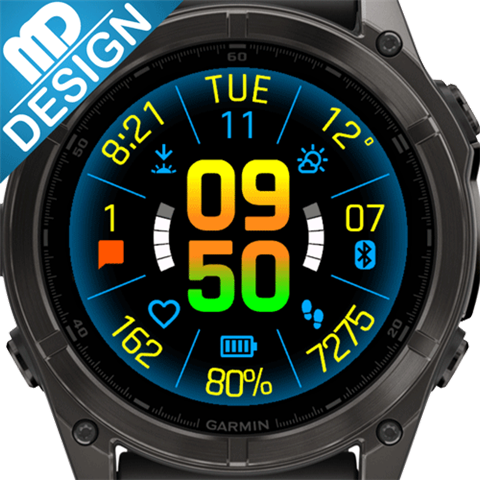
Watchface: Glance

NEW: Just published a new app - EASY Round. Give it a try!

apps.garmin.com/.../9a619d99-3e5b-4eec-81e7-006655d797cc
EASY Round

GLANCE WATCH FACE app won THE BEST NEW WATCH FACE APP OF 2022 ! At the Developers conference Garmin announced nominees and winners for the best apps in different categories. Glance Watch Face was nominated and won in the best new watch face category Slight smile! Garmin didn't post the video from the conference yet, but it was already reported by other websites: https://the5krunner.com/2022/10/12/garmin-app-watchface-of-the-year-2022-ciq-winners-and-nominees-announced/
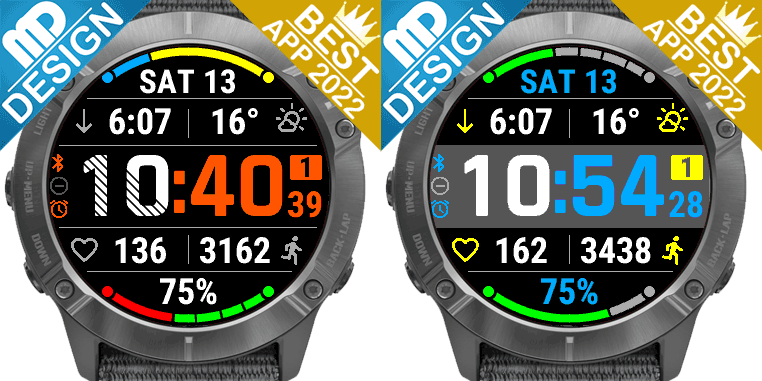
The idea for this app is simple:
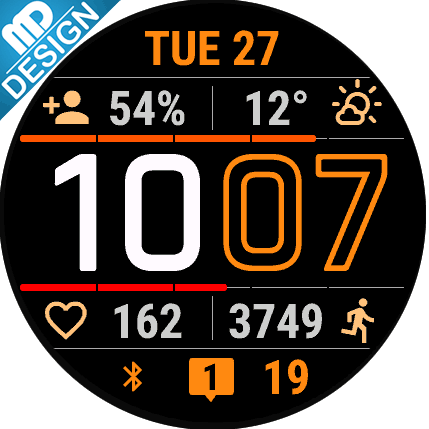
- Use only large fonts, so that all data are visible at a glance (hence the name of the app: Glance   )
- Put as much data on the screen as possible, without sacrificing font size above
- Make all data fields customizeable to your needs
- Make colors customizeable as much as possible, so users can create their own design

The "Glance Watch Face" app is 100% FREE - no hidden restrictions, nagging, or expiration:
https://apps.garmin.com/en-US/apps/07ae ... 07e8035fae

There is also a mostly free app - BIG EASY: apps.garmin.com/.../86ec352b-da01-4806-8972-770c6d32a5e8
There are also two paid versions of this app - "Glance Pro":

https://apps.garmin.com/en-US/apps/ac4be3ce-f0f3-4c49-be01-5fa52614ab2b

and "Glance Dual Screen":

https://apps.garmin.com/en-US/apps/5c0fe72b-f045-4366-a878-d3e67c600868

Paid versions are identical to the free version (so no worries, FREE doesn't mean bad!), but have a lot of extra features features:

  • Open Weather Map support
  • Setting for TIME font weight
  • New way to use shared color themes
  • Support for many new metrics (like Body Battery, Stress Level, and lots more)
  • Extra progress bars and Graphs (in Dual Screen only)
  • Two separate data screens (in Dual Screen only) 
  • A lot more - see apps description for the full list
  • You have an opportunity (and a small incentive) to support the development Slight smile

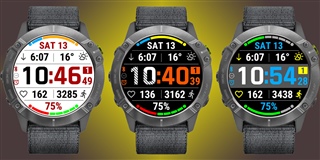
Unique feature of the Glance apps - you can save your own Color Themes and quicly switch between them righ on the watch.

NEW: Now you can SHARE your Color Theme! You can also quickly apply Color Themes shared with you. Here is a full description of how it all works: https://www.mobiledriveway.com/glance.html#color

Here is the current Color Themes Gallery: https://www.mobiledriveway.com/glance_gallery.html

Color themes are compatible between "Glance" and "Glance Pro" (except for "inactive status icons color", which became obsolete in "Pro").

I'd love to see all color combinations you came up with. Please post your themes in the Reviews and I'll add them to the gallery!

Questions and suggestions are welcome!
  • Hello MobileDriveway, 

    As I said in my review on Connect IQ, I really love this watch face and I’m very grateful for all the work and effort you've spent to realize it. 

    And, as suggested in reply to my review, I’m posting here my suggestions for possible new features:


    - Use the same font, that is used for the time, for metrics as well.


    - Change the icon of barometric pressure to reflect pressure trend (especially when increasing or decreasing).


    - Make it possible to go for 3 data fields on top and/or bottom (maybe sacrificing icons to maintain a bigger font). I personally believe that having the possibility to break symmetry between the upper and lower part would be nice. For instance, one could set 3 fields to show date, month and outside temperature or steps, floors and active minutes (I guess there would no need of icons to understand what’s shown).


    - Add moon phase in metrics with a (minimalistic and clean) representation of the moon.

    - Finally, although I understand that this is not yet possible (and Garmin should really make it possible as I already asked to them directly), it would be great to have Body Battery and/or Stress available on watch face.

    P.S.: I have some other ideas but I'm hesitant to post them here as I'm not sure they will fit in this project. Should you be interested for other projects, I will share with you. Cheers and happy new year!

  • Thanks for the suggestions!

    - Use the same font, that is used for the time, for metrics as well.

    It is already the same stock (installed on the watch) font, nothing else.

    Change the icon of barometric pressure to reflect pressure trend (especially when increasing or decreasing).

    I'm looking for a simple algorithm on how to calculate pressure trend from a history of readings (1 / min). If someone can share one, I can implement it.

    Make it possible to go for 3 data fields on top and/or bottom (maybe sacrificing icons to maintain a bigger font).

    That would be better done in a different version of the app. And no, the fonts can't stay the same size for 3 metrics in 1 row, even without icons. Good idean on breaking a symmetry, but that would be a task for a different version of the app.

    - Add moon phase in metrics with a (minimalistic and clean) representation of the moon.

    Good idea to add it as a metric (I'm sure you know that it is already included as a bar). I might add it when I have time.

    it would be great to have Body Battery and/or Stress available on watch face.

    They are coming with the next big Garmin Watches OS update. I expect it to be available on very limited models though.

    I have some other ideas but I'm hesitant to post them here as I'm not sure they will fit in this project.

    Ideas are always welcome! Post them here or to me directly through Contact Developer. You might not know, but I have few more apps published in the IQ store (under WooSports) - those started as interesting projects too!

  • The pressure trend besides the pressure i/o the icon would really be a great addition if possible. Actually garmin ABC tool already reports it under the form of an arrow going up down or horizontal, but not sure it's made avaliable to developers. 

  • Actually garmin ABC tool already reports it under the form of an arrow going up down or horizontal, but not sure it's made avaliable to developers. 

    It isn't. So I am looking for a clear trend algorithm - what defines it and by how much pressure should chnage to indicate a trend. Like should it be at least 1% for example?

  • Hi,

    Well, it turns out that I might not be capable of coding a watch face, but I'm pretty good at algorithms (I develop Fortran CFD codes). Concerning barometric pressure trend, a good way of doing it would be to compute a linear regression of past data and set the trend according to the sign of the slope of the linear fit.

    To do so, let us assume that we have a set of pressure readings P(1, 2, 3,... N) at times T(1, 2, 3,... N). Then, the slope of the linear regression would be computed with the following code (that's Fortran but should be straightforwardly converted in whatever language is used to build Garmin watch faces):

    ST = 0.0

    ST2 = 0.0

    SP = 0.0

    STP = 0.0

    do i = 1, N

       ST = ST + T(i)

       ST2 = ST2 + T(i) * T(i)

       SP = SP + P(i)

       STP = STP + T(i) * P(i)

    end do

    SLOPE = (N * STP - ST * SP ) / ( N * ST2 - ST * ST ) 

    A positive (negative) SLOPE would mean that the data are increasing (decreasing).

    To make the thing more meaningful, it would possibly be better to set a threshold to establish wether or not the computed slope reflects a sufficiently significant change. In practice, if the data are in hPa and are sampled every minute, then the computed slope is in units of hPa per minute. The problem then would be to know how many hPa/min represent a significant change to assume that the weather is changing. Then, if THR is this threshold, then 'SLOPE >= THR' means a significant increase whereas 'SLOPE <= -THR' means a significant decrease. 

    Unfortunately, I have no clue what THR would be.

    Finally, a way simpler (but possibly less elegant, although more battery friendly) way of doing the thing is to simply compare the pressure now with its value an hour ago and set the trend accordingly.

    Hope my explanation was clear enough ;)

  • I forgot to mention that, after a first execution of the 'loop', subsequent values of the SLOPE can be computed by discarding oldest values and adding newest values. Since the sampling frequency is always the same and the T array does not change (say T = 0 min, 1 min, 2 min, 3 min, etc.), the change is only in the values of SP and STP:

    SP = SP - P(oldest) + P(newer)

    STP = STP - T(oldest) * P(oldest) + T(newer) * P(newer)

    SLOPE = (N * STP - ST * SP ) / ( N * ST2 - ST * ST )

    Also, since the denominator is always the same, this is better stored as its reciprocal to execute the division only once:

    RDEN = 1.0 / ( N * ST2 - ST * ST )

    SLOPE = (N * STP - ST * SP ) * RDEN

  • Thanks. It is clear, but I'm looking for a more "official" algorithm for pressure trend, something that would match other services (if they report a trend). Last thing I want is to report a trend when it is just a normal change of a few hPa...

  • I am not new to Garmin, but I am new to the Fenix line. I just got a Fenix 6 Sapphire Titanium for Christmas. I installed a half-dozen watch faces and have been using At A Glance most of the time. Very nice work! 

    One question I have is about the barometric pressure reading and the last update. I swear the upper right data field previously showed two decimal points. However, it is now only showing tenths. For example, 29.89 vs 29.9. Am I mistaken? Either way, is it possible to show to the hundredths for inHG? Thanks!

  • Thanks. Yes, it went to 1 decimal point in the last update (after I added mmHG). I guess I can change it to 2 in the next update - not sure when it will happen though.