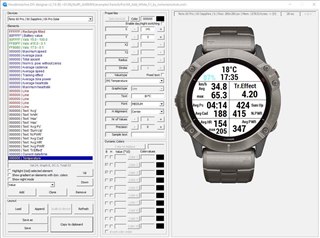
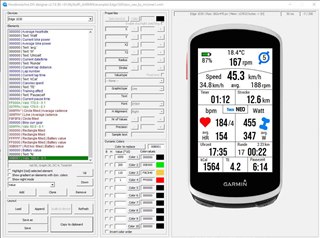
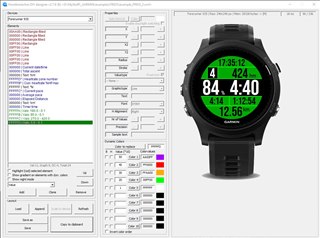
HMs DIY #1-6

Store Link

Because I want to keep this datafield and the app free for use I would be very grateful about a small donation to PayPal

A detailed description of how to use it can be found here: 

HMs_DIY_GUIDANCE.pdf
HMs_DIY_ANLEITUNG.pdf

Thanks very much to mcinner1 for putting so much time into this documentation!

Designer download

You can contribute on my github page.
You can upload your layout so others can use it as well.
Also any changes to the fonts.txt can be updated there as well.

Garmin_HMsDIY

=======================================================================
RELEASE NOTES
=======================================================================
-----------------------------------------------------------------------
3.5.1
* switched to new SDK 4.2.4
* added devices: FR265, FR265S, FR965, GPSMAP 67/67i, Marq (Gen 2), Marq (Gen 2) Aviator, EDGE 540, EDGE 840, Instinct 2x Solar
* added two new font types GLANCE, GLANCENR (only available if device supports it!)
-----------------------------------------------------------------------
3.4.2
* switched to new SDK 4.1.5
* added devices: Edge Explore 2, Venu Sq 2, Venu Sq 2 Music Edition
-----------------------------------------------------------------------
3.4.1
* switched to new SDK 4.1.3
* added devices: Instinct 2S / Solar / Dual Power, D2 Air X10, D2 Mach 1, Descent G1 / G1 Solar,
Edge 1040 / 1040 Solar, Forerunner 255, Forerunner 255 Music, Forerunner 255s, Forerunner 255s Music, Forerunner 955 / Solar, Instinct 2 / Solar / Dual Power / dezl Edition
* fixed crash when windspeed was not available from device
-----------------------------------------------------------------------
3.3.1
* switched to new SDK 4.0.9
* added devices: D2 Air, Descent MK2/MK2i, Descent Mk2S, Enduro, epix Gen2, Fenix 7, Fenix 7S, Fenix 7X, Forerunner 55, Forerunner 945 LTE, Venu2, Venu2 Plus,
Venus 2S, Venu Sq, Venu Sq Music,

for full releasenotes see: releasenotes.txt
=======================================================================
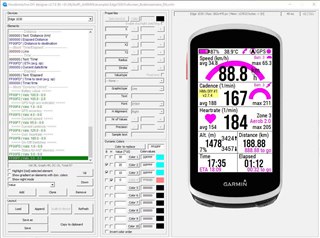
 

  • Yes - in the example it is 220 cm for 29“ MTB.

  • Here is the two I have for the two chainrings

    <LayoutElement type="3" text="----- Bike Gear -----------"/>
    <LayoutElement type="0" color="000000" x="165" y="135" fixedtext="false" maxonly="false" daynight="true" eletype="BG" text="214;50;11;13;15;17;19;21;23;25;27;30;34" font="MEDIUM" halignment="1" precision="0" nr_values="1" sampletext="5"/>
    <LayoutElement type="0" color="000000" x="96" y="135" fixedtext="false" maxonly="false" daynight="true" eletype="BG" text="214;34;11;13;15;17;19;21;23;25;27;30;34" font="MEDIUM" halignment="1" precision="0" nr_values="1" sampletext="5"/>

  • I am quite excited to try this. Looks awesome. I just started to set up a data field. Can anybody tell me which units are used for distance values? Is it switching between m and km depending on the size of the value or is it always one of those? Is it depending on the value (e.g. distance vs. elevation)? Is it displaying the unit after the value or do i need to know whether the next point is in 20 m or 20 km?

  • Can anybody tell me which units are used for distance values?

    Depending on setup your device, the default units are:
    (to set in System - Units...)

    Distance:  km/mi
    Elevation:  m/ft
    Temperature: C/F
    Time 24/12 hours

    In DIY designer for most values "$V" in text field represents the default value.
    There's no switching meters/kilometers depending of the value. You have to declare the number of decimal places under "precision".
    (For distance I chose precision=1 - means precise for 100m))

    Only for time there are different possibilities to display H, M, S.

    I recommend to read the Guidance PDF (especially pages 11 and 12. For time formats page 30)

  • Thanks a lot. I read the whole PDF, but the units used for distance I could not find. But it's clear now after your response. 

  • When making a graph, are you able to define how frequently measurements are plotted on the graph? For example, I want to make a graph that shows an elevation profile. How do I set the frequency with which measurements are plotted, and what period of time / number of recordings the graph covers (eg 2 hours, 200 measurements, etc.)? 

  • I read the documentation again, and I think I'm understanding that the number of values shown in the graph is dictated by the stroke (ie smaller stroke means more values shown in graph). And that values are recorded every second.

    So I don't think this would work for my intended application, where I want to draw an elevation profile during a hike.

    Is there a way to plot elevation against distance or time? For time, is there a way to have time increments longer than one second? 

  • You have understood the system correctly. You cannot show the elevation in function of the distance.

  • Is it possible to have time increments longer than one second? 

  • No, unfortunately not.