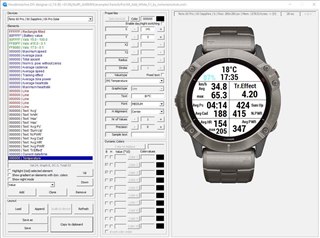
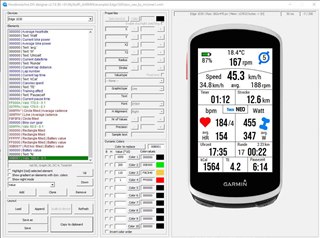
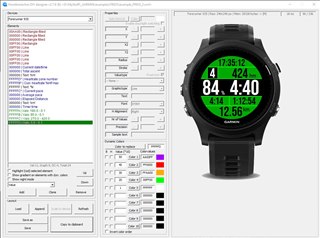
HMs DIY #1-6

Store Link

Because I want to keep this datafield and the app free for use I would be very grateful about a small donation to PayPal

A detailed description of how to use it can be found here: 

HMs_DIY_GUIDANCE.pdf
HMs_DIY_ANLEITUNG.pdf

Thanks very much to mcinner1 for putting so much time into this documentation!

Designer download

You can contribute on my github page.
You can upload your layout so others can use it as well.
Also any changes to the fonts.txt can be updated there as well.

Garmin_HMsDIY

=======================================================================
RELEASE NOTES
=======================================================================
-----------------------------------------------------------------------
3.6.2
* switched to new SDK 7.2.1
* added devices: Approach S7 42mm, Descent Mk3 43mm /Mk3i 43mm, Descent Mk3i 51mm, Edge 1050, epix Pro Gen2 42mm, epix Pro Gen2 47mm / quatix 7 pro, epix Pro Gen2 51mm / D2 mach 1 pro / tactix 7
Fenix 7 Pro, Fenix 7 Pro Solar, Fenix 7S Pro, Fenix 7X Pro, Fenix 7xPro Solar, Forerunner 165, Forerunner 165M, Venu 3, Venu 3S, Vivoactive 5
-----------------------------------------------------------------------
3.5.1
* switched to new SDK 4.2.4
* added devices: FR265, FR265S, FR965, GPSMAP 67/67i, Marq (Gen 2), Marq (Gen 2) Aviator, EDGE 540, EDGE 840, Instinct 2x Solar
* added two new font types GLANCE, GLANCENR (only available if device supports it!)

for full releasenotes see: releasenotes.txt
=======================================================================
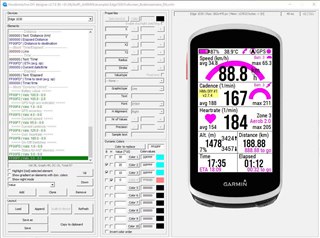
 

  • New version 2.9.2 (designer only).

    http://public.stattegg.info/HM_DIYD_2.9.2.zip

    -----------------------------------------------------------------------
    2.9.2 (designer only)
    * fixed crash in designer when changing values for graph

  • I updated the datafield to version 2.9.2 too, there was a problem loading the graphs in the datafield, sorry for that...

    -----------------------------------------------------------------------
    2.9.2
    * fixed crash in designer when changing values for graph
    * fixed crash where graph is not loading because of an empty array

  • A little update before I go to bed (-:

    New version 2.9.3 on clone #6:

    http://public.stattegg.info/HM_DIYD_2.9.3.zip

    -----------------------------------------------------------------------
    2.9.3
    * fixed x position for right/left graphs
    * added checkbox for marking min/max values in graph

  • Nice.

    I wonder if it would be possible to translate the "dots" mix and max values in the graph to data fields so they can be overlaid.

    Something completely else, I've been wondering about: The 184 (HR) value has a Y value of 0. It seems to me that there are at least 20 px on the F6 at the top where I cannot place data?

  • I've needed negative coordinates before, too. I entered the minus sign manually into the XML file. It works!
      Maybe you could remove the lock for negative coordinates.

  • No problem, I will change to lower limit of the coord fields.

    Anything else that should be changed or does not work correctly?

  • Anything else that should be changed or does not work correctly?

    Concerning GRAPHs:
    Work perfectly!
    Just one thought:
    I'm not sure about using the "cap function" max. value, because I would say: showing the max value is of interest.
    But on the other hand - capping the min value would be more interesting:
    Think of heartrate or cadence...
    HR: values from 0 to 40-60 (depending...) are not possible but always shown as a colored block in the graph.
    Cadence: low values are possible but of no interest...

    But I'm not sure about it - let's ask the community!

    Anyway - thank you once more for this wonderful work!

    What I am really missing is ANT values ebike-battery and -supportlevel - but I have to wait for a new CIQ version. Hopefully they add this feature in the near future  Heart eyes

    EDIT:
    What I did not see...   max. value is not only a "cap function", it also can be used to fix the height-scale of the graph. And that makes sense of course.
    (If set max. value to 0 the currently highest value is on top edge of the graph rectangle.)

  • The minimum value is a good idea to focus on the "relevant" area of the graph.

  • Somebody knows what Font (or Fontmapping) in the Designer belongs to the "bigger" Font in 4 Data Fields Configuration on Forerunner 245?
    The NR_MEDIUM is too small and the NR_HOT is too big...

    Cheers, Ondrej

  • Can you please submit the code of the shown layout?