ANT+ HRM Heart Rate Monitor 
 ️
️

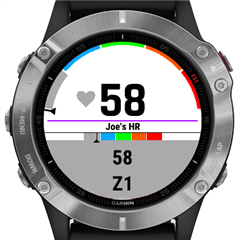
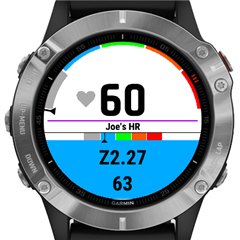
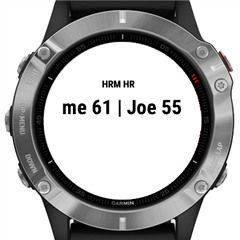
- "internal", "watch", "WHR", "OHR" sensor is used for either the built-in wrist heart rate sensor or an external (ANT or Bluetooth) sensor that is paired and connected to the watch (Menu - Sensors & Accessories - [Your HRM] - Status - Connected)
- "external" or "HRM" or "auxiliary" is used for any ANT sensor that is not connected to the watch but is broadcasting and the watch is receiving it's signal. It can be a chest EKG sensor or optical armband or even the training partner's watch that is set to broadcast HR on ANT (Menu - Sensors & Accessories - Wrist Heart Rate - Broadcast During Activity - On)
Initially, the strongest external sensor's signal is picked up and remembered throughout the activity.
To avoid tracking the wrong sensor (for example during a race where many people run with ANT HR sensors), the ANT ID can be fixed in the data field settings.
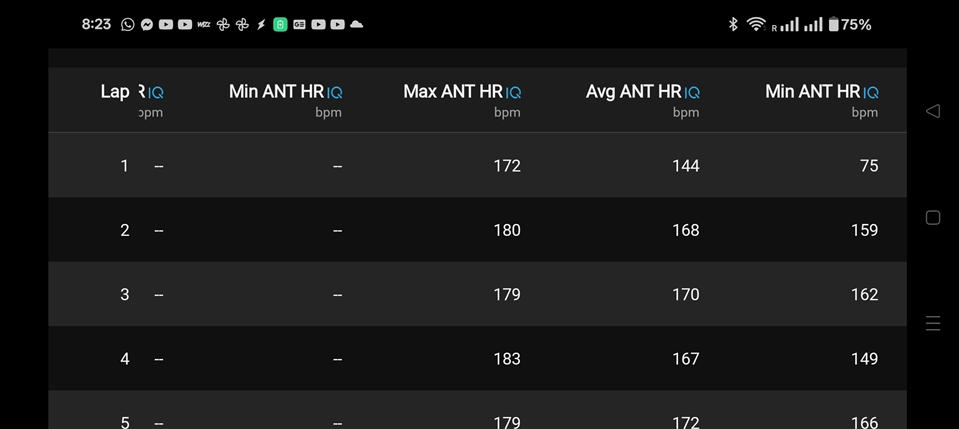
- Comparing an auxiliary heart rate sensor (i.e: chest strap or armband) to the internal optical HR sensor of the watch
- Compare two ANT+ sensors (one connected to the watch vs one not connected to the watch) to see the difference and analyse them
- Monitor and record a training partner's HR for pacing during an activity. My device natively connects to my HR sensor and this data field connects to my partner's, so during the activity I can see how hard they are going while pacing in the front, and still - in parallel - see and record my own HR
- Monitor a horse's HR during a horseback ride
- Only connect to ANT ID - If set, then it will only connect to that device. Set to 0 to search and connect to the closest device.
- Set name for connected ANT HRM - Enter an alias for the currently connected sensor. This alias will be saved & displayed in Garmin Connect in any activity recorded using this sensor.
You can save multiple users.
- Name
- ANT ID
- HR Zones - "u" - use user's HR zones | "m:{maxHR}" | "z:{minZ1},{maxZ1},{maxZ2},{maxZ3},{maxZ4},{maxZ5}"
- Low/High HR Alert - alert when below/above given zone/HR - (0 - off | 1..5 - when below/above zone | 30..255 - when below/above HR)
- Display format part 2 - i.e: "z{z}"
- Show HR zone gauge
- Show HR zone color - color background according to zone
Any ANT+ HR monitor, see: https://www.thisisant.com/directory/smart-hrm/ , i.e:
4iiii Viiiiva
Accuro LYNK2
BKOOL, Bontrager
Bowflex
Bryton
Cardiosport
CATEYE
CooSpo
Dayton
Decathlon
DREAM SPORT
Echelon Beat
Echowell
Fitcare
FITCENT
Garmin HRM/SS/Dual/Swim/Run/Tri/Pro
Geoid
Hammerhead
iBike
iGPSPORT
Kinetic inRide H1
Kyto
LIVLOV
Magene
MIO
Mobii
Peloton
Polar H9/H10/OH1/Verity Sense
PowerTap
POWR LABS
Scosche Rhythm
Senda JetBlack
Shanren
Sigma R1
Tacx
Timex
TopAction
Topeak
VDO
Vortec
Wahoo Fitness: TICKR/FIT/Run/X
Walio PULSE
XOSS
Xplova
## Languages
English
Hebrew
Hungarian
2.5.3.2 (2024-10-10)
- added edge1050
2.5.3.1 (2024-10-01)
- added enduro3, fenix8*
2.5.2 (2024-07-26)
- added User #3 (for newer devices)
- fixed low/high HR alert crash on older devices
2.5.0 (2024-07-16)
- added alert screen. To enable: Activity Settings ≫ Alerts ≫ Add New ≫ Connect IQ Data Fields ≫ ANT+ HRM ≫ Edit data field settings? ≫ No
- added battery icon
- added setting to record invalid HR
- added settings whether to record each FIT field to prevent crashes in case other data field records many fields
- improve contrast between background color and text
- fix for HRM-s that don't send heart beat time (i.e: MyZone)
- display ANT ID in label in case there's no name set in the settings
- added setting to hide label
- added fr165
- bug fixes
2.3.2 (2024-01-28)
- bug fixes
2.3.1 (2023-11-12)
- added new devices
- bug fixes
2.3.0 (2023-03-19)
- use bigger fonts when possible
- fixed label font size
- fixed position on edge devices
- different low HR and high HR alert tone
- changed OHR in the display format from {h} to {o}.
- bug fixes
2.2.0 (2023-01-17)
- added Low / High HR Alert (newer devices only)
- removed sensors from settings
- added new devices
- bug fixes
2.1.0 (2022-10-24)
- IMPORTANT: NEED TO SET THE DISPLAY FORMAT AGAIN WHEN UPGRADING FROM EARIER VERSION!
- changed format to use {.} instead of $.$ to prevent crashes because of bad settings
- allow extended 20-bit ANT ID-s
- fixed HR zone color, display '--' when disconnected during activity
- only connect to the same sensor when resuming activity
2.0.0 (2022-10-03)
- show name in the field label
- added HR zones
- added graphical HR zone gauge
1.0.2 (2022-06-05)
- fixed a bug in some watches
1.0.1 (2022-06-03)
- added fr255, fr955, code optimizations
1.0.0 (2022-05-31)
- IMPORTANT: Please delete and install again!
- complete rewrite. Settings have changed.
- can save alias for 3 external sensors
- added all older devices with only 16Kb memory
0.3.1 (2022-05-09)
- optimized fit file
- added settings for internal(watch) HR display
- fixed ANT certification problems
0.1 - Based on versions of IMGrant, flyingflo


