
German version of this description is available: forums.garmin.com/.../datafield-sphgrawh-deutsch
WHERE TO FIND SPHGraWH AFTER DOWNLOAD:
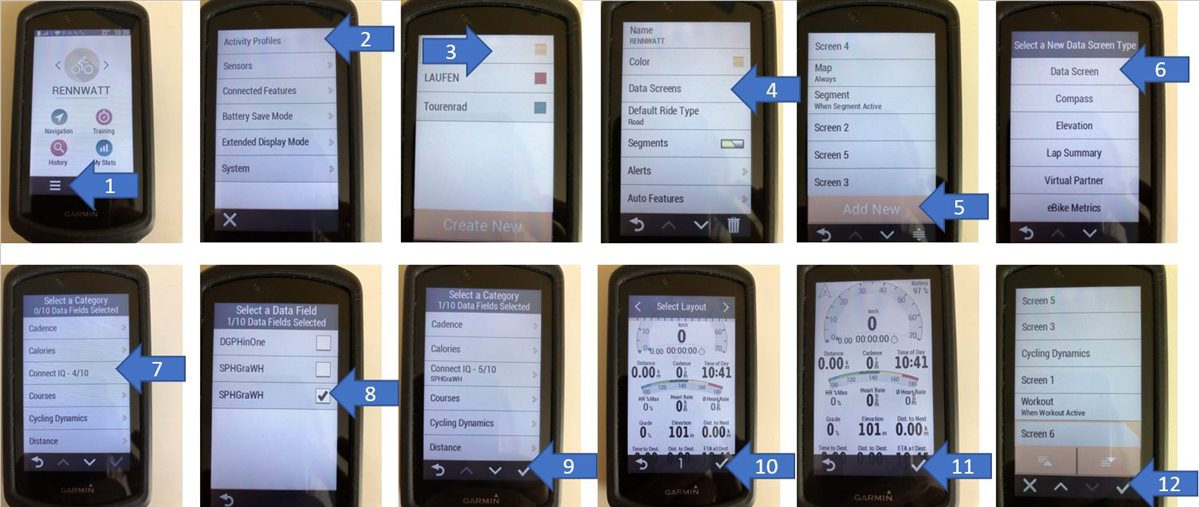
To bring SPHGraWH onto the screen please select “connected features and settings” (1).
Then choose your activity profile (2-3).
Next select “Data Screens” to create a new data screen (4-5).
The new data screen should have the type “Data Screen” (6) and contain a Connect IQ app (7).
Please select “SPHGraWH” (8) and confirm the following pages (9-12).
For screenshots see picture below.
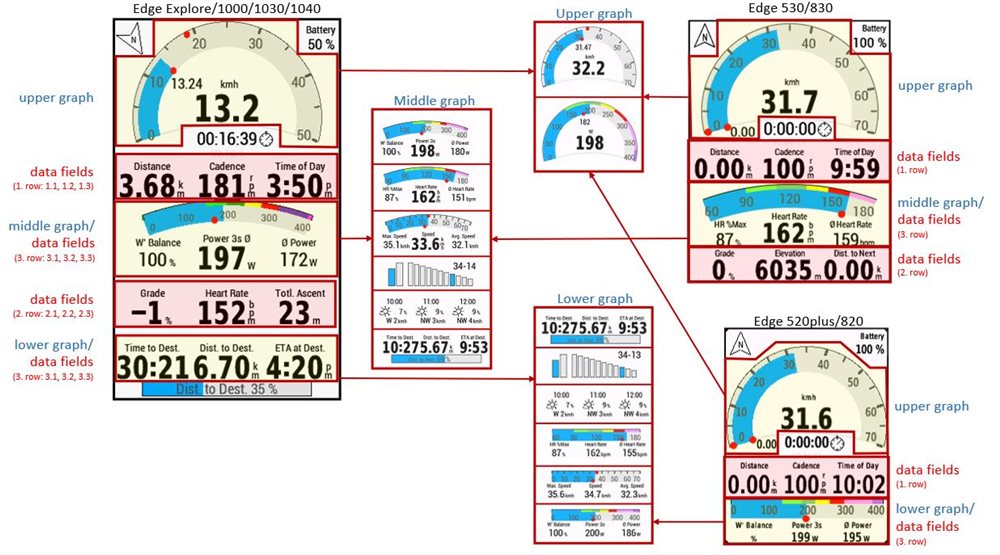
MAIN ELEMENTS:
- Speed-Graph with current speed, average speed and maximum speed
- Compass with wind bearing marker if weather is available/GPS Quality/Temperature/Time of day/Direction. Bearing marker shows the heading the wind is blowing from relative to your heading.
- Battery
Depending on your device there are up to nine customizable fields with the following defaults:
- Elapsed Time
- Distance
- Cadence
- Time of Day
- Grade
- Total Ascent/Elevation/Gear-Combo/Temperature
- Time to Destination
- Distance to Destination
- ETA at Destination
List of available fields (Availability depends on Edge device and paired sensors)
- DistanceA - CadenceB - Time of DayC - GradeD - ElevationE - Totl. AscentF - Heart RateG - Avg. Heart RateH - HR %MaxI - Avg. SpeedJ - PowerK - Avg. PowerL - Watts/kgM - W' BalanceN - LR Balance (if supported by your power meter and power meter is paired via ANT+)O - Training EffectP - Gear ComboQ - Max. SpeedR - TemperatureS - Dist. to NextT - Time to Dest.U - Dist. to Dest.V - ETA at Dest.W - NPX - IFY - TSSZ - VS - 30s Avg.a - Avg. Cadenceb - Caloriesc - HR Zoned - Power Zonee - % HRRf - Speedg - Rear Gearh - Dist. Uphilli - Max. HRj - Max. Power
Additional information graphs (not available on all Edge devices)
- Power-Graph with power zones based on ftp value (only available if power meter is paired and active)
- Gear information graph (only available if cadence sensor or electronic shifting is paired and active)
- 3 Hour Weather Forecast (only available if your Edge device supports weather data)
Please note:
If no electronic shifting is paired gear information is calculated from speed and cadence (sensor needed). Sometimes gear information maybe incorrect due to similar gear ratios.
LAYOUT:
SCREEN LOCK and TOUCH-SENSITIVE AREAS:
The app can be locked to prevent settings being changed accidentally. The lock is activated/deactivated by double tapping.
A padlock is visible to the left of elapsed time when the app is locked..
On devices with a touch-sensitive screen elements can be changed by tapping the screen.
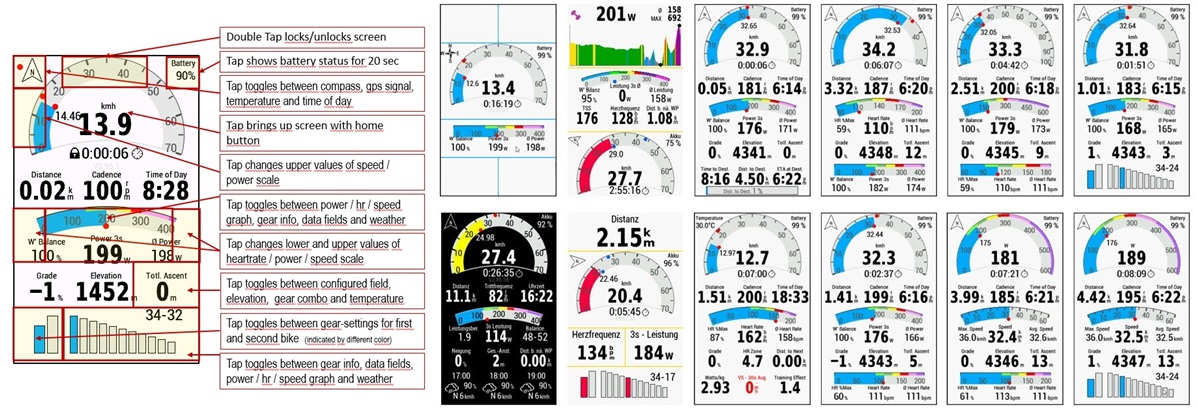
HEART RATE AND POWER GAUGE:
If a power meter is paired the heart rate graph automatically changes to power graph. Also the values beneath this graph change from heart rate to power.
CONFIGURATION OPTIONS VIA OVERLAY:
When the “Trip Counter, FTP, and Speed to Destination” overlay is enabled you can double-tap at the right edge of the upper graph to bring this overlay up.
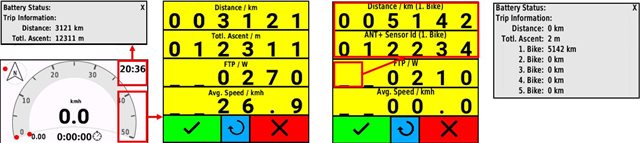
The digits can be increased individually by tapping the digit. “9” is followed by “0” and there is no carryover to the next digit.
Exit the overlay and save the values by tapping the checkmark (green).
Exit the overlay without saving any values by tapping the cross (red).
Trip Counter:
Elapsed distance and elevation gain since last reset are automatically updated and saved when you complete an activity.
If necessary, corrections can be made via the overlay.
The values can be reset to 0 by tapping “Reset” (blue).
Distance and ascent since last reset can also be shown by tapping the top right corner.
FTP:
In addition to change your own FTP value via the app settings, the FTP value can also be changed directly in the app.
Speed used to calculate estimated time of arrival (ETA):
There are three different calculation methods depending on the value:
- 0.0 km/h (0.0 mph):
average speed is used to calculate ETA - less than or equal 1.6 km/h (1.0 mph):
current speed is used to calculate ETA - greater than 1.6 km/h (1.0 mph):
configured speed is used to calculate ETA
Odometer for 5 bikes:
The overlay for trip counter, FTP and speed to destination can be configured to include an odometer for 5 bikes.
Tapping on the left edge of the third line changes the content of the first and second line. Odometer can be set in the first line.
An ANT+ Id of a sensor can be entered in the second line.
Odometer and ANT+ Id can be set for up to 5 bikes.
When you save an activity the ANT+ IDs of paired sensors are checked against the ANT+ IDs of bikes 1 to 5. If there is a match the distance of the activity increases odometer value of the corresponding bike.
AVAILABLE APP SETTINGS (Garmin Connect IQ or Garmin Express needed):
- configuration string for font sizes, colors, speed graph range and something more
- W PRIME (J)
- FTP (W)
- heart rate graph range
- up to nine customizable fields
- wheel size (for two bikes)
- sensor device ID for bike identification (for two bikes)
- gear size for calculation gear information (for two bikes)
You can configure 1-3 chain rings and up to 14 sprockets, i.e.
- 32;50-42-36-32-28-24-21-18-16-14-12-10
- 50-34;28-25-23-21-19-17-15-14-13-12-11
- 44-33-22;30-26-23-20-18-16-14-12-11
Wheel size, gear sizes and ANT+ ID can be set for two bikes.
AUTOMATIC BIKE IDENTIFICATION:
If you have two bikes with non electronic shifting the configuration of gear sizes for each bike might be identified by the ANT+ ID of a cadence, speed, speed cadence or power sensor (not supported by all devices, i.e. Edge 1000). So you don’t have to toogle between these bikes by a touch on the screen.
When automatic bike selection is not configured by setting the ANT+ IDs you can select manually (see picture with touch screen areas)
SPEED HUBS:
Rohloff speed hub and Shimano internal geared "8"-speed and "11"-speed hubs can be configured without knowing the internal gear combos. Chain ring and sprocket have to be configured using the following format ’<teeth of chain ring><Identifier for hub>-<teeth of sprocket>;01’.
Valid identifiers and examples for a chain ring with 42 teeth and sprockets with 14 to 16 teeth:
| Identifier | Description | Example |
| R14 | Rohloff Speed Hub | 42R14-16;01 |
| S08 | Shimano Internal Geared Hub 8-speed | 42S08-15;01 |
| S11 | Shimano Internal Geared Hub 11-speed | 42S11-14;01 |
| P12 | Pinion 12-Gang Nabe | 42P12-14;01 |
| P09 | Pinion 9-Gang Nabe (XR) | 42P09-14;01 |
| P06 | Pinion 6-Gang Nabe | 42P06-14;01 |
Chainring and sprocket size always have to be two digit values.
ELECTRONIC SHIFTING AND DECIMAL GEAR SIZES:
If electronic shifting is paired to your Edge device the SPHGraWH settings for Device ID, wheel size and gear sizes are ignored.
Instead you have to configure your chain rings and cogs on your Edge device. SPHGraWH will take these values to display your actual gear combo.
You can enter decimals for gear sizes. For example you can enter 50-34;28-25-23-21-19-17-15-13813212-11 instead of 50-34;28-25-23-21-19-17-15-14-13-12-11.
In this case the value 13.8 is used for gear calculation. Also 13.2 is used for gear calculation. On the other hand you will see 14 on the screen instead of 13.8. The values 13.2 is displayed as 13.
This can be used to optimize identification of gear sizes.
VALIDATION OF SETTINGS:
When you changed settings and pushed the save button please keep an eye on your Edge. If there was any invalid input a message is displayed at your Edge for 15 seconds if you are using Garmin Connect or Connect IQ. If you use Garmin Express and your device is in mass storage mode no message could be displayed.
In every case of invalid input the default value is used instead of the invalid input parameter.
FTP ZONES (SPHGraWH can not get ftp zones from user settings):
FTP zones are calculated according to the following list:
- Zone1 from 0% to 55% FTP
- Zone2 from 55% to 75% FTP
- Zone3 from 75% to 90% FTP
- Zone4 from 90% to 105% FTP
- Zone5 from 105% to 120% FTP
- Zone6 from 120% to 150% FTP
- Zone7 from 150% to .... FTP
STANDBY DURING ACTIVITY RECORDING:
When your Edge is put to standby while activity recording is active W’ bal (diff) calculation goes on. When you turn your device on and you continue activity recording standby time is considered for W’ bal (diff) calculation.
CONFIGURATION OF FONT SIZES, COLORED BAR GRAPH AND VISIBILITY OF FIELDS:
Further settings can be made using the 29 character sized configuration field. The characters of this configuration string are used to modify some properties of SPHGraWH. For example dynamic colors for the bar graphs or larger font sizes can be set. If you would like to activate a feature then set the according cipher to the value described beneath. In a “large font” scheme the larger font size is used wherever possible. So individual font size changes via the configuration string only take effect if a non “large font” scheme is selected. For the entire configuration string please have a look at the following explanation:
Description of ciphers in the display settings field:
0000-0000-0000-0000-0000-0000

 ¦¦¦¦.¦¦¦¦.¦¦¦¦.¦¦¦¦ ¦¦¦¦.¦¦¦¦

 ¦¦¦¦.¦¦¦¦.¦¦¦¦.¦¦¦¦ ¦¦¦¦.¦¦¦Speed gauge

 ¦¦¦¦.¦¦¦¦.¦¦¦¦.¦¦¦¦ ¦¦¦¦.¦¦Color scheme

 ¦¦¦¦.¦¦¦¦.¦¦¦¦.¦¦¦¦ ¦¦¦¦.¦Content of upper right field

 ¦¦¦¦.¦¦¦¦.¦¦¦¦.¦¦¦¦ ¦¦¦¦.Extra values beneath speed in bar or curved scale

 ¦¦¦¦.¦¦¦¦.¦¦¦¦.¦¦¦¦ ¦¦¦¦One decimal place for 3-digit distance values

 ¦¦¦¦.¦¦¦¦.¦¦¦¦.¦¦¦¦ ¦¦¦Initial content of upper left field

 ¦¦¦¦.¦¦¦¦.¦¦¦¦.¦¦¦¦ ¦¦Right power field

 ¦¦¦¦.¦¦¦¦.¦¦¦¦.¦¦¦¦ ¦Mid power field

 ¦¦¦¦.¦¦¦¦.¦¦¦¦.¦¦¦¦ Left power field

 ¦¦¦¦.¦¦¦¦.¦¦¦¦.¦¦¦Right HR field

 ¦¦¦¦.¦¦¦¦.¦¦¦¦.¦¦Mid HR field

 ¦¦¦¦.¦¦¦¦.¦¦¦¦.¦Left HR field

 ¦¦¦¦.¦¦¦¦.¦¦¦¦.Power

 ¦¦¦¦.¦¦¦¦.¦¦¦¦Overlay for trip counter, FTP, speed to destination and odometer for 5 bikes

 ¦¦¦¦.¦¦¦¦.¦¦¦W’ bal calculation

 ¦¦¦¦.¦¦¦¦.¦¦Larger font size for upper left and right values

 ¦¦¦¦.¦¦¦¦.¦Larger font size for values beneath bar scale

 ¦¦¦¦.¦¦¦¦.Shrink view while radar bar is shown

 ¦¦¦¦.¦¦¦¦Bar graph for distance to destination

 ¦¦¦¦.¦¦¦Larger font size for gear combo in gear info

 ¦¦¦¦.¦¦Larger font size for values beneath curved scale

 ¦¦¦¦.¦Larger font size for average speed

 ¦¦¦¦.Larger font size for elapsed time

 ¦¦¦¦Power gauge

 ¦¦¦Layout of upper scale

 ¦¦Content of middle scale

 ¦Dynamic color for HR/Power bar graph

 Display rear gear
In detail:
Speed gauge
   0000-0000-0000-0000-0000-0000

                                |

                                0: 0-30 kmh / 0-15 mph

                                1: 0-40 kmh / 0-20 mph

                                2: 0-50 kmh / 0-25 mph

                                3: 0-60 kmh / 0-30 mph

                                4: 0-70 kmh / 0-35 mph

                                5: 0-80 kmh / 0-40 mph

                                6: 0-90 kmh / 0-45 mph

                                7: 0-100 kmh / 0-50 mph
Color scheme
   0000-0000-0000-0000-0000-0000

                               |

                               0: blue

                               1: red

                               2: green

                               3: yellow

                               4: pink

                               5: blue with large font

                               6: red with large font

                               7: green with large font

                               8: yellow with large font

                               9: pink with large font
Content of upper right field
   0000-0000-0000-0000-0000-0000

                              |

                              0: Battery

                              1: Temperature

                              2: Time of day

                              3: Direction
Extra values beneath speed in bar or curved scale
   0000-0000-0000-0000-0000-0000

                             |

                             0: Show all values

                             1: Hide extra values

                             x: Hide all values
Decimal place for distance values
   0000-0000-0000-0000-0000-0000

                            |

                            -: one decimal place for up to 2-digit distance values

                            ,: one decimal place for up to 3-digit distance values
Decimal place for 3-digit values can lead to overlapping ciphers on some devices.
Initial content of upper left field
   0000-0000-0000-0000-0000-0000

                           |

                           0: Compass and wind bearing

                           1: Compass

                           2: GPS Quality

                           3: Temperature

                           4: Time of day

                           5: Direction

                           6: Compass and wind bearing

                           7: Battery
Marker for wind bearing is only available if your Edge device supports weather data provided through Garmin Connect app.
Right power field
   0000-0000-0000-0000-0000-0000

                          |

                          0: Default value

                          1: W’ Balance

                          2: Power

                          3: LR-balance

                          4: Avg. Power

                          5: Watts/kg

                          6: NP Approximation

                          7: IF Approximation

                          8: TSS Approximation

                          9: Power Zone

                          s: Speed

                          x: Hide value

                     A-Za-j: Selection according to list of available fields
Mid power field
   0000-0000-0000-0000-0000-0000

                         |

                         0: Default value

                         1: W’ Balance

                         2: Power

                         3: LR-balance

                         4: Avg. Power

                         5: Watts/kg

                         6: NP Approximation

                         7: IF Approximation

                         8: TSS Approximation

                         9: Power Zone

                         s: Speed

                         x: Hide value

                    A-Za-j: Selection according to list of available fields
Left power field
   0000-0000-0000-0000-0000-0000

                        |

                        0: Default value

                        1: W’ Balance

                        2: Power

                        3: LR-balance

                        4: Avg. Power

                        5: Watts/kg

                        6: NP Approximation

                        7: IF Approximation

                        8: TSS Approximation

                        9: Power Zone

                        s: Speed

                        x: Hide value

                   A-Za-j: Selection according to list of available fields
Right HR field
   0000-0000-0000-0000-0000-0000

                      |

                      0: Default value

                      1: %Max Heart Rate

                      2: Heart Rate

                      3: Avg. Heart Rate

                      4: Trainingeffect

                      5: Heart Rate Zone

                      6: % Heart Rate Reserve

                      7: max. Heart Rate

                      x: Hide value

                 A-Za-j: Selection according to list of available fields
Mid HR field
   0000-0000-0000-0000-0000-0000

                     |

                     0: Default value

                     1: %Max Heart Rate

                     2: Heart Rate

                     3: Avg. Heart Rate

                     4: Trainingeffect

                     5: Heart Rate Zone

                     6: % Heart Rate Reserve

                     7: max. Heart Rate

                     x: Hide value

                A-Za-j: Selection according to list of available fields
Left HR field
   0000-0000-0000-0000-0000-0000

                    |

                    0: Default value

                    1: %Max Heart Rate

                    2: Heart Rate

                    3: Avg. Heart Rate

                    4: Trainingeffect

                    5: Heart Rate Zone

                    6: % Heart Rate Reserve

                    7: max. Heart Rate

                    x: Hide value

               A-Za-j: Selection according to list of available fields
Power
   0000-0000-0000-0000-0000-0000

                   |

                   0: 3 seconds average power

                   1: 10 seconds average power

                   2: current power
Overlay for trip counter, FTP and speed to destination
   0000-0000-0000-0000-0000-0000

                  |

                  -: Overlay is disabledd

                  =: Overlay is enabled

                  #: Overlay is enabled including odometer for 5 bikes
W’ bal calculation
   0000-0000-0000-0000-0000-0000

                 |

                 0: Integral calculation method

                 1: Differential calculation method
Larger font size for upper left and right values
   0000-0000-0000-0000-0000-0000

                |

                0: Default font size

                1: Large font
Larger font size for values beneath bar scale
   0000-0000-0000-0000-0000-0000

               |

               0: Default font size

               1: Large font
Shrink view while radar bar is shown (not available on Edge 1000)
   0000-0000-0000-0000-0000-0000

              |

              0: Feature is deactivated

              1: Shrink view when radar detects a threat (radar track on right side)

              2: Additionally show relative speed of first target in right field beneath upper gauge

              3: Additionally show absolute speed of first target in right field beneath upper gauge

              4: Shrink view when radar detects a threat (radar track on left side)

              5: Additionally show relative speed of first target in left field beneath upper gauge

              6: Additionally show absolute speed of first target in left field beneath upper gauge
Bar graph for distance to destination
   0000-0000-0000-0000-0000-0000

             |

             -: shows covered distance to destination as 0% -> 100%

             =: shows remaining distance to destination as 100% -> 0%
Larger font size for gear combo in gear info and unit for wind speed
   0000-0000-0000-0000-0000-0000

            |

            0: Default font size gear combo

            1: Large font size gear combo

            1: Wind speed in m/s

            1: Large font size  gear combo and wind speed in m/s
Larger font size for values beneath middle gauge
   0000-0000-0000-0000-0000-0000

           |

           0: Default font size

           1: Large font size

           2: Bar Graph with large font size instead of curved graph
Larger font size for average speed
   0000-0000-0000-0000-0000-0000

          |

          0: Default font size

          1: Large font size
Larger font size for elapsed time
   0000-0000-0000-0000-0000-0000

         |

         0: Moving time and default font size

         1: Moving time and large font size

         2: Total time of activity and default font size

         3: Total time of activity and large font size
Power gauge
   0000-0000-0000-0000-0000-0000

        |

        -: Customizable by tapping

        _: 0 - 400 W (fixed; can not be changed by tapping)

        +: 0 - 600 W (fixed; can not be changed by tapping)
Layout of upper scale
   0000-0000-0000-0000-0000-0000

       |

       0: Round scale plus digital display value

       1: Show elapsed time within upper scale

       2: Needle in upper scale without digital display value

       3: Needle in upper scale with digital display value

       4: Large Font Size for actual value

       5: Hide digital display of average value
Layout of middle scale
   0000-0000-0000-0000-0000-0000

      |

      0-6: Possible values for content of graphs. (see table below)
| Value | Upper graph | Middle graph | Lower graph |
|---|---|---|---|
| Devices with upper, middle and lower graph | |||
| 0 | Speed | Power/HR | Gears/HR/Weather/Data fields |
| 1 | Speed | Gears | Gears/HR/Weather/Data fields |
| 2 | Speed | HR | Gears/Power/Weather/Data fields |
| 3 | Power/Speed | Speed/HR | Gears/HR/Weather/Data fields |
| 4 | Power/Speed | HR | Gears/Speed/Weather/Data fields |
| 5 | Speed | Weather/HR | Gears/HR/Weather/Data fields |
| 6 | Speed | Data fields | Gears/HR/Weather |
| Edge 850/550/840/540/830/530/MTB | |||
| 0 | Speed | Power/HR | |
| 1 | Speed | Gears | |
| 2 | Speed | HR | |
| 3 | Power/Speed | Speed/HR | |
| 4 | Power/Speed | HR | |
| 5 | Speed | Weather/HR | |
| 6 | Speed | Data fields | |
| Edge 820/520plus | |||
| 0 | Speed | Data fields | |
| 1 | Speed | Gears | |
| 2 | Speed | Power/HR | |
| 3 | Speed | HR | |
| 4 | Power/Speed | HR | |
| 5 | Power/Speed | Speed/HR | |
- Weather is not available on all devices. If weather is not available:
- heart rate is displayed instead in the middle graph
- weather is omitted in the lower graph
- Gear info is only shown when cadence sensor or electronic shifting is paired. Otherwise
- heart rate is displayed in middle graph
- gear info is not available as bottom graph
- If no power meter is paired or power meter is in sleep mode:
- speed is displayed instead of power in the upper graph
- heart rate is displayed instead of power in the middle graph
- power and heart rate are omitted in the lower graph
Set dynamic color for HR/Power bar graph
   0000-0000-0000-0000-0000-0000

    |

    0: Default color for heart rate and power graph

    1: Colored graph depending on heart rate zone or power zone
Display rear gear instead of gear combo
   0000-0000-0000-0000-0000-0000

   |

   0: Show gear combo in gear info

   1: Show rear gear in gear info

   2: Show rear gear in upper graph

   x: Hide gear combo in gear info
For example if you want to have colored bar graphs and a larger font for elapsed time you have to set the values second and sixth position to:
“0100-1000-0000-0000-0000-0000”
BACKGROUND COLOR:
Background color is set according to the day/night color of your device.
TRAININGEFFECT:
When there is no Trainingeffect available on your device burned calories are displayed instead. Display switches to calories when Trainingeffect is zero for more than 30 seconds.
SENSOR BATTERY INFO:
If you tap onto the upper right corner of the screen you will get a list of active sensors if battery information is available for the sensor. This information is shown for 20 seconds and then disappears automatically. There is no language support. Information is actually only available in English. Looking at a line there is at first the type of sensor (power meter, speed, cad, speed cad). Then there is a marker to indicate the battery status: light green=new, green=good, yellow=ok, red=low, magenta=critical. Next you will find the battery voltage and at the end of the line the operation time in hours. Please note that not all sensors provide all information or battery status at all. So don’t be disappointed if the list is very short or empty. Please don’t expect a battery status for DI2 or any heart rate sensor.
To my experience only newer speed or cadence sensors and most power meters provide a battery status.
WEATHER DATA:
On some Edge devices you can display weather forecast for the next three hours. You get this information by toggling through the information in the bottom line or the middle graph of SPHGraWH. Please note that weather data is only displayed if it is provided by Garmin Connect App running on your smartphone.
If no weather data is displayed there might be several reasons.
- The installed firmware does not support weather data for custom apps
- Your Edge is not connected to a smartphone with Garmin Connect App running
- Weather is not enabled in the settings of your Edge device
USING PARTS OF SPHGRAWH:
SPHGraWH adapts to the available height of a field if you choose to have more than one field on your data screen.
The displayed part of SPHGraWH depends on the available height of the field. To get a reasonable result the field as to be at least 78 pixel high.
Here is an overview of available constellations:
| part of full screen | 1/2 | 2/5 | 1/3 | 1/4 | 1/5 |
| 1040/1030 | Speed+ | Speed | HR/Power+ | HR/Power | Gears |
| 1000/Explore(2) | Speed | --- | HR/Power+ | Gears | Gears |
| 850/550/840/540/830/530/MTB | Speed | HR/Power+ | HR/Power | Gears | Gears |
| 820/520plus | HR/Power+ | --- | Gears | --- | --- |
| Speed: | Speed gauge only |
| Speed+: | speed gauge plus one row of data |
| HR/Power: | heart rate or power graph (depending on paired sensors) |
| HR/Power+: | heart rate or power graph plus one row of data |
| Gears: | gear information |
On touch devices you can change some settings by tapping onto the screen just like in full screen mode.
Please note: If you have SPHGraWH displayed in two or more fields on the same data screen tapping might be available only in one field.
CALCULATION OF ETA AT DESTINATION:
ETA at destination as well as distance to destination and time to destination are only available if you loaded a course. Otherwise these values are zero or the actual time. When a course is loaded distance to destination is the remaining distance to the destination of the loaded course. ETA is calculated from distance to destination and actual average speed. If actual average speed is zero for example before your start your ride then ETA is calculated with fixed average speed of 26 km/h.

