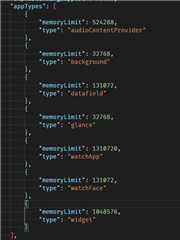
I have developed a data field and I am really on the memory limit for some of the devices. Basically as soon as I add any more code/functionality to the data field I get "out of memory" in the sim (even one line of code may tip it over). I understand that memory available for data fields is restricted and the only way forward for me is to optimize memory usage of my data field.
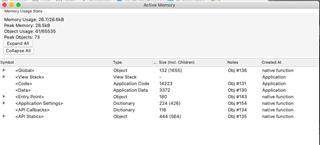
On the Phoenix 5 Sim, I get peak usage 28.5kB, so clearly hitting the memory limit, but when I bring up the memory usage stats in the sim, the memory size does not add up to the 28.5kB. I'm using a background process, could it be that the memory used in background is not shown here?
In order to optimize memory usage, would it make a big difference to move from layouts to dc.writes? I currently have many layouts, and I load a specific layout based on the obscurity flags and device type (with simple data field I could just let the system render with the proper font size, but this is a complex data field so I need to take care of that myself). It would add a lot of complexity to the code if I were to change to dc.writes, but if that will save me some memory it might be worthwhile, what are your thoughts?
I am also loading a bitmap resource in runtime, from a list of approx 10 bitmaps. Each bitmap is approx 250 bytes. I only load one bitmap and not the entire list, to preserve as much memory as possible. Is there anything in terms of handling resource and bitmaps that I should think about in order to save memory?
I store some user settings and other variables I need to share between the main process and background process, will objects stored in the object store also consume from the 28kB memory pool? and if so, is there any other approach that would be more efficient?
Sorry for asking such open questions but wanted to see if some of you experienced developers have som tips and tricks for me. Many thanks in advance!
/Fredrik