Position of setClip is affecting Graphics Time

I have witnessed an interesting behavior and looking for advice:

I am using a drawArc method to render seconds within a 124 x 30 area. I set a clip in this area as part of the onPartialUpdate() and noticed the Graphics Time increased incrementally, from zero to 50000, as the seconds progressed. 

I thought the increment was due to the increasing size of the arc, so I modified the function to append small arc segments to each other. This did nothing to change the Graphics Time behavior, so then I modified the clip to be 20x20 and follow the location of the arc segments as they were drawn. This also did nothing. 

Finally, I hard coded the segment angle and noticed something interesting.... the Graphics Time was being affected by segment angle itself. For example, if the seconds arc is between zero and 30 degrees, setting a 2 degree arc at the start (0) had a Graphics Time of almost zero while setting a 2 degree arc at the end (30) has a Graphics Time of 50000. 

Any idea what is going on here? There are other objects drawn around and behind the arc, but I am just rendering the arc segments within the onPartialUpdate(). 
  • The thing that impacts the power budget when it comes to the clip region is the number of rows.  If it's 100 rows, the budget will be higher than if it's  20.  If you have multiple clip regions it's from the min row of the combined region to the max.

    So if you have a clip region at a, 20 to b, 30 and another at c,100 to d,120, the rows involved are 20 to 120 (100 rows).

    Make sure you're setting the clips correctly, and the way I do that is set the clip, then fill the background with a different color so you can see it on the screen.

    I have a WF that does something similar to what you are, and in onPatrialUpdate, I just tack on 6 degrees to the end of the arc, and I'm looking at total times of 14000 to 16000.

  • Thanks for the feedback. The odd thing is I am only setting a single 20x20 clip, drawing my segment and immediately running clearClip(). The only difference between updates is the location of the clip, but the row count (20) should be the same with every onPartialUpdate, right? 

    I am going to try your background fill suggestion and verify the clips are actually clearing. 

    UPDATE: Ok, I ran the background test and found the following:

    1. Filling the background shows the clip is working as expected - I am only drawing within a single 20x20 clip with each update. 
    2. I noticed drawing full screen vs. clipped screen affected the Display Time vs. the Graphics Time, so setting a clip  seems to have less of an effect on rendering graphics and more of an effect on displaying them, which would make sense given the row explanation.  
    3. Removing the drawArc() and just filling the clipped background in an arc pattern resulted in a consistent render time of 9,000.

    All said and done, it looks like there is something inconsistent with the render time for drawArc(), based on screen location.

    UPDATE2: I created a new project and I cannot reproduce the problem when its rendering the arc on a blank WF. So, looks like I need to rebuild my WF starting with the seconds arc and add the other elements one-by-one until the issue reproduces. Very odd. 

  • I only call clearClip() at the beginning of onUpdate.  Try taking it out of onPartialUpdate and putting it in onUpdate.

  • I implemented my seconds rendering on a new project and I was able to optimize it in isolation. The onPartialUpdate() render is now around 6000 total and that value holds consistently for every update. I still do not know why the other project is behaving the way it is but, in hindsight, I am realizing I should refactor the render anyway, given the learnings from this exercise. I'll test the power budget as I go so I can pinpoint any draw sequences that result in this behavior again. Thanks again for the feedback. 

  • The heuristic we use to estimate the cost of rendering an arc is based on the area. It is affected by the radius and the sweep angle and nothing else.

    There is an additional cost associated with the number of lines affected by all draw operations. This additional cost is limited by the clipping rect.

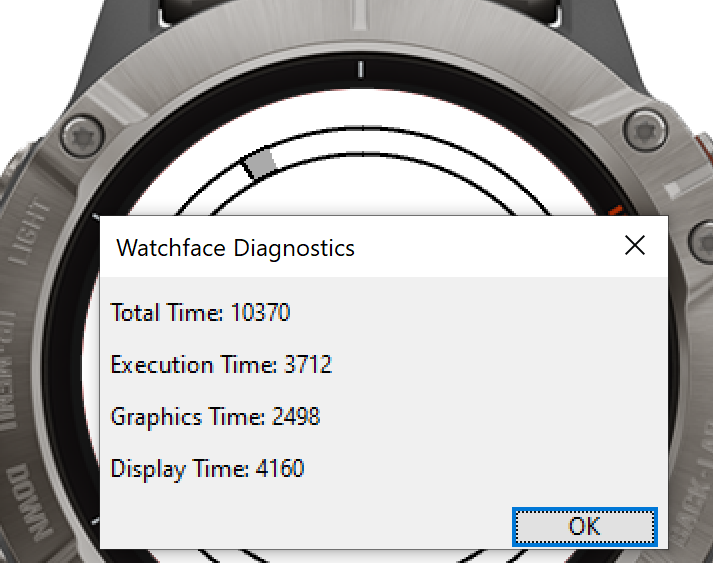
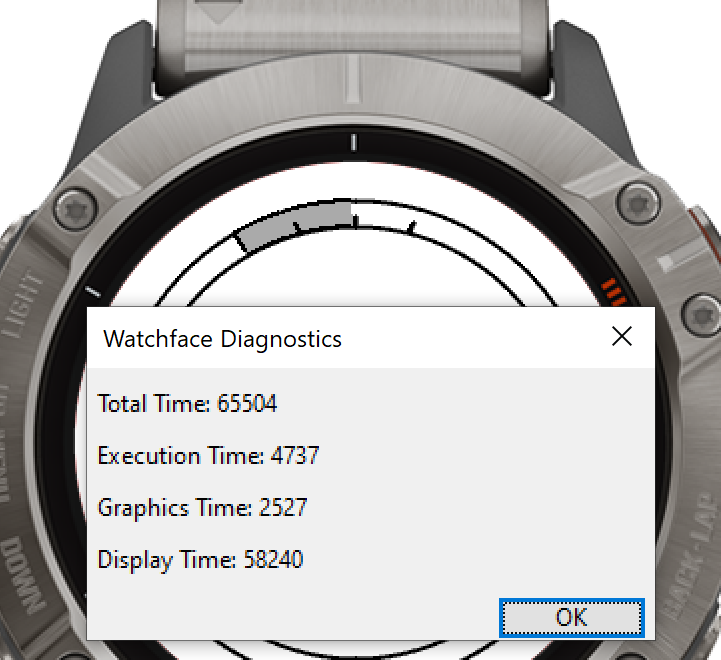
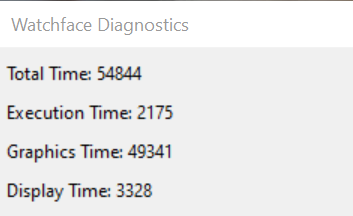
  • Thanks Travis. I finally ran into a similar issue again while rebuilding my face. All was going well until I decided to draw three tick lines over my seconds arc... at this point the display time jumped from 4,000 to 60,000. I verified the clip was still in effect by doing the background test as suggested above. I thought it may be related to excessive object count but I removed almost all of the face elements and the issue persisted. 

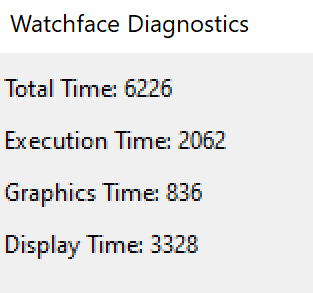
    The only difference between the faces highlighted below is one is drawing three lines over the arch and one is not. The three ticks are redrawn with every onPartialUpdate(). There is a 20x20 clip that follows the gray arc as it is rendered one degree at a time. The number of ticks does not seem to matter... even drawing one line during a single onPartialUpdate() causes that particular update to spike to 60,000. Is this a known behavior or am I just special? :)

    UPDATE: I was reading back over Jim's feedback and tried removing the clarClip() again within my seconds function (I had tested this early on with no effect). In this case, moving clearClip() to onUpdate() resolved the issue. :)

    Btw, This suggests something is triggering a full screen refresh between onPartialUpdate() calls? Or perhaps there is a race condition when clearing the clip right after a draw method? Guessing its the latter but any feedback is appreciated. Thx!

  • I’ll have to look at the clearClip code and the side effects. There shouldn’t be a big cost to doing it, but I’m guessing the issue is that we’re somehow using the union of all clip areas used during the partial update to determine the cost.

    I’ll take a look at it tomorrow.

  • I'm not seeing anything obvious, but that doesn't mean that something isn't there. I'll look at this further tomorrow.

  • No worries. My issue is resolved with the workaround, so I am now just curious to see what you find. :)

    Thx again to you and Jim for the timely feedback. If anything, this turned out to be a good exercise in learning more about the intricacies of draw method power costs and power management in general. ;) 

  • Former Member
    0 Former Member

    I was having difficulty in getting `drawArc()` to complete its operation within the strict time limit that `onPartialUpdate()` demands. It would increase past 30ms as the arc got closer to completing a full 360° rotation, which was unacceptable. 

    I approached the problem from another angle (no pun intended). Instead of forcing myself to use `drawArc()`, instead in low power mode I'm doing the following:

    1. Calculating the x/y point of the screen at which my arc is updating
    2. Blowing that point up to a box that's 20px wide and 20px tall, 10px back from my calculated point and 10px upwards from it
    3. Using that bounding box as my clip
    4. Drawing a circle of my desired width within that box

    The result is that in low power mode, the arc is seamlessly filled. When `onUpdate()` is fired, it's still filled because my code switches back to drawing an actual arc for that one call.

    var circle_point = {
      "x" => centre_x - (radius - 1) * Math.cos(angle_in_radians),
      "y" => centre_y - (radius - 1) * Math.sin(angle_in_radians)
    };
    if(low_power_mode){
      dc.setClip(circle_point["x"] - 10, circle_point["y"] - 10, 20, 20);
      dc.setColor(0xAA0000, Graphics.COLOR_TRANSPARENT);
      dc.fillCircle(circle_point["x"], circle_point["y"], 3);
    }
    else{
      //Draw your normal arc here, etc.
    }