This is something that you had to do before ERA came about, but I don't think the steps have ever been posted, so though I would.
Let's say a user send you a ciq_log file, but without debug symbols, all you see is pc: in the stack trace. Here's how to narrow it down. This is what happens when you see a ERA report.
Let's say the ciq_log has this:
Error: Unexpected Type Error
Details: 'Failed invoking <symbol>'
Time: 2020-06-26T14:52:49Z
Part-Number: 006-B3113-00
Store-Id: 12b4e4ef-353c-4935-909c-315f6e6ad5f8
Store-Version: 23
Filename: A6IC0712
Appname: Pi GD
Stack:
  - pc: 0x100014eb
  - pc: 0x100008e7
So, what is pc: 0x10014eb? It's the hex value for the program counter. You need the associated debug.xml to understand that (this is what ERA does - that mapping - the debug.xml for a target is included in the .iq file you sent to the store, so it can be located there, under the part number folder, and you can see what that is from the manifest.xml in the .iq file - or, as in this case, the part number is in the ciq_log.)
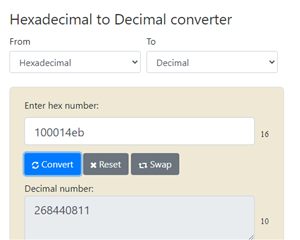
debug.xml has everything in decimal and not hex though, so you need to convert the value. I use this site to convert:
https://www.rapidtables.com/convert/number/hex-to-decimal.html
So,

then, in the debug.xml file, you want to look for something close to the decimal value of 268440811, and here's what I see:
<entry filename="C:\\Users\\James\\workspace-prod\\PiGdJM2\\source\\PiGdView.mc" id="27" lineNum="117" pc="268440775" symbol="initialize"/>
<entry filename="C:\\Users\\James\\workspace-prod\\PiGdJM2\\source\\PiGdView.mc" id="27" lineNum="118" pc="268440815" symbol="initialize"/>
And what that tells me, is it's between line 117 and 118 in that specific .mc file!

