While it is rather complicate to make Garmin responding to bug reports or to feature requests regarding Garmin Connect Web, it is often possible to make the changes ourselves, locally. A feature of the Chrome browser, called Local Overrides, allows it - you can customize not only the look of the pages, but in some cases, and to certain extent, even the functionality.
When reading the forums, I saw many requests, where the overrides could be used, and decided to test whether it could be done. After some testing I decided to share the results with the community.
The installation of the overlays is easy - it is sufficient to download the file archive, unzip it into a folder, and then assigning and enablig it in Chrome DevTools. Detailed description of the functionality, and step-by-step installation instructions are available on GitHub. The only inconvenience is, that to keep the GCOverrides active, the DevTools pane or a window need to stay opened. The best way of doing so, is detaching them from the current page as a separate window, and minimizing them.
Recently, the Local Overrides work also on the latest Microsoft Chromium Edge.
The installation process is explained in details in the README file.
Current Features (GCO v1.20)
- Weight - 6 Months Report - brings back the 6 Months report plotting all weight data within the 6 motnhs period (not only monthly averages like the 12 Months report does) Note: as of 2020/04/03 I noticed a new look of the Weight page in GC, and this feature of GCO does not work with it. However, since it still seems to be just an intermediate version, suffering some problems, I'll wait till Garmin fixes the bugs, before trying to add the 6 months report again.
- Activity Overlays bugfix - adds missing overlays and their labels on zoomed graphs on the Activity pages
- Floors per Min bugfix - fix of the incorrect pace on the native GC Floors Climbing Activity page
- Configurable Sleep Goal - see the chapter Setings in README.md for instructions
- Conversion of Calories to kilojoules on the Calories In/Out page and on the Dashboard; needs to be enabled in the GCO Settings
- Adjustable Y-axis on Graphs - turns the majority of graphs to have adjustable Y-Axis (with the help of selecting a rectangle of the current graph). Please note, that due to the compression of JavaScript files and the use of numeric chunks in GC, this feature may require frequent updates, and/or may not work for everyone. Searching for a more stable hack.
- Panning of Graphs - the user can press the Shift key and drag the mouse in order to pan a zoomed graph (same limitations as at the previous feature)
- Exportable Graphs - additional Export menu at zoomed graphs allowing the export of graphs as images or PDF
- Enhanced Graph Tooltips - Distance added to all time-based activity graph tootips; improved formatting of tooltips on zoomed versions
- Hiding Golf - optional hiding of Golf from the Side Menu and from the Gear Menu;
- Hiding Model-Based Badges - badges designed only for exclusive watches may be hidden from the list of available badges
- Enabling manual date input in Reports - in the native version, on the Progress Summary page of Reports, the date can only be picked from the Calendar. Now you can enter it manually.
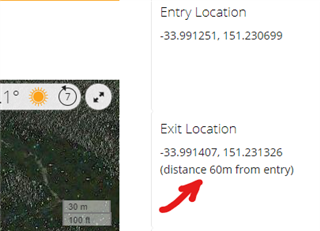
- Diving Distance - information about the aerial distance between the entry and the exit locations of a dive
- Step Counts for Activities - on the pages of activities of the type Run and Walk, the count of steps done during the activity is displayed
- ... more to come
For details, please have a look at the CHANGELOG
(I'll be updating the list of features above, when new ones will be added)


