This discussion has been locked.
You can no longer post new replies to this discussion. If you have a question you can start a new discussion

GCOverrides

While it is rather complicate to make Garmin responding to bug reports or to feature requests regarding Garmin Connect Web, it is often possible to make the changes ourselves, locally. A feature of the Chrome browser, called Local Overrides, allows it - you can customize not only the look of the pages, but in some cases, and to certain extent, even the functionality.

When reading the forums, I saw many requests, where the overrides could be used, and decided to test whether it could be done. After some testing I decided to share the results with the community. 

The installation of the overlays is easy - it is sufficient to download the file archive, unzip it into a folder, and then assigning and enablig it in Chrome DevTools. Detailed description of the functionality, and step-by-step installation instructions are available on GitHub. The only inconvenience is, that to keep the GCOverrides active, the DevTools pane or a window need to stay opened. The best way of doing so, is detaching them from the current page as a separate window, and minimizing them.

Recently, the Local Overrides work also on the latest Microsoft Chromium Edge.

The installation process is explained in details in the README file

Current Features (GCO v1.20)

  • Weight - 6 Months Report - brings back the 6 Months report plotting all weight data within the 6 motnhs period (not only monthly averages like the 12 Months report does) Note: as of 2020/04/03 I noticed a new look of the Weight page in GC, and this feature of GCO does not work with it. However, since it still seems to be just an intermediate version, suffering some problems, I'll wait till Garmin fixes the bugs, before trying to add the 6 months report again.
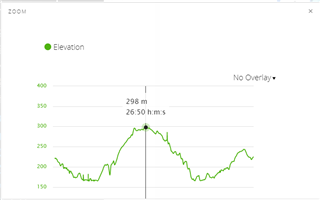
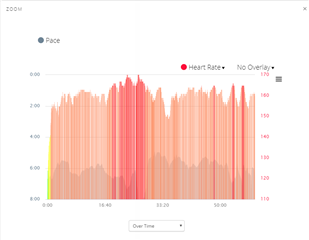
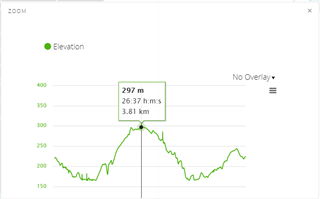
  • Activity Overlays bugfix - adds missing overlays and their labels on zoomed graphs on the Activity pages
  • Floors per Min bugfix - fix of the incorrect pace on the native GC Floors Climbing Activity page 
  • Configurable Sleep Goal - see the chapter Setings in README.md for instructions
  • Conversion of Calories to kilojoules on the Calories In/Out page and on the Dashboard; needs to be enabled in the GCO Settings
  • Adjustable Y-axis on Graphs - turns the majority of graphs to have adjustable Y-Axis (with the help of selecting a rectangle of the current graph). Please note, that due to the compression of JavaScript files and the use of numeric chunks in GC, this feature may require frequent updates, and/or may not work for everyone. Searching for a more stable hack.
  • Panning of Graphs - the user can press the Shift key and drag the mouse in order to pan a zoomed graph (same limitations as at the previous feature)
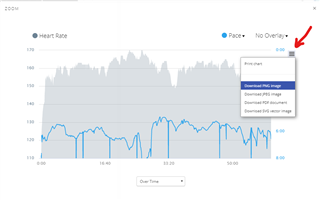
  • Exportable Graphs - additional Export menu at zoomed graphs allowing the export of graphs as images or PDF
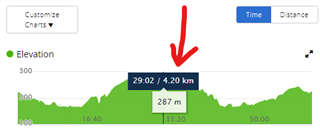
  • Enhanced Graph Tooltips - Distance added to all time-based activity graph tootips; improved formatting of tooltips on zoomed versions
  • Hiding Golf - optional hiding of Golf from the Side Menu and from the Gear Menu;
  • Hiding Model-Based Badges - badges designed only for exclusive watches may be hidden from the list of available badges 
  • Enabling manual date input in Reports - in the native version, on the Progress Summary page of Reports, the date can only be picked from the Calendar. Now you can enter it manually.
  • Diving Distance - information about the aerial distance between the entry and the exit locations of a dive
  • Step Counts for Activities - on the pages of activities of the type Run and Walk, the count of steps done during the activity is displayed
  • ... more to come

For details, please have a look at the CHANGELOG

(I'll be updating the list of features above, when new ones will be added)

  • Yes another update - v1.05Panning of Graphs (EXPERIMENTAL) - the user can press the Shift key and drag the mouse in order to pan a zoomed graph.

    The same limitations as at the previous feature apply - this feature may turn out to be difficult to maintain due to (possibly) frequently changing numbering of JavaScript chunks in the compressed JavaScript packaging. I am still trying to find a workaround, and hence a stabler functionality, but am unsure about the outcome.

  • New version 1.07 allows now the export / saving of  activtity graphs as images (PNG, JGP, SVG) or PDF. At the full-size zoomed activity graphs, you can click the hamburger symbol on the right side, to get the Export menu as shown on the following screenshot:

  • New version 1.09 brings improvements to the tooltips on the activity graphs. The mouse-over tooltips on the graphs of the activity page, normally show only the time of the respective point (or alternatively they show only the distance). With GCO, the tootlips now show both the time and the distance in the same time. The distance is shown on both versions of the graphs - on the default ones on the activity page (see the first screenshot), as well as on the full-size zoomed versions (second screenshot). The format of the tootlip at the full-size version was changed to improve the readability (for comparison see the unmodified original tooltip of a zoomed graph on the thrid screenshot)

      ««« 

  • Yet another small addition in v1.10 for those who don't like golf - you can now hide it completely from the left navigation menu as well as from the gear page. It is an option in the GCO settings. By default, there is no change - golf is visible just like in standard Garmin Connect without any local overrides.

  • Where are the GCO settings?  

  • Where are the GCO settings? 

    Currently they are in the gauth-widget.js file - details are described in the README.md file. The easiest is accessing and editing it directly in the DevTools of Chrome, when you are on the Sources screen and the Overrides tab.

    Later I will probably move the settings into an independent file in the root, but it is not available yet. Originally there was only a single parameter which was not worth of the effort, but as the number of features and options grow, I'll try to make it easier accesible and editable.

  • ... and another addition in v1.11 - Now you can hide all watch-model-based badges. Badges designed only for exclusive watches (i.e. the Captain Marvel, Dart Vader, First Avenger,...) will be by default hidden from the list of available badges. You can disable the filter by clearing the parameter gcoHideBadges, or add your own language (if not included), or any additional keywords from badges you do not want to see on the list. By default, only watch-based badges in English, French, Spanish, German, and Czech versions of Garmin Connect will be filtered out.

  • Nice work :)

    Would it also be possible to modify heartrate graphs to show HR zones with them? In the way Polar Flow does it:

    Polar Flow HR chart

    To me this is very informative way to present HR data.

  • Yes, I started to work on it already a week ago, and it is also on the GCO Wish List, but it is rather complex, so it may take much more time. Currently I have only the possibility to show the HR zones by overlaying one of the existing graphs (i.e. the Pace graph) with HR - the HR overlay is then turned into a semi-trandsparent bar graph with the colors of the bars in individual key-points, corresponding to the HR zone. And also, I did not solve yet the reading of the HR zone data from GC, hence for the moment, they are still just hardocded into the code. That told, if it interrests you anyway even before it is completed, and despite being far from ideal, I can tell you how to turn the feature on in the current version, and how to adjust the HR zone threasholds in the code.

    This is a sample screenshot:

  • New version 1.12 enables the possibility of manual setting or modifying of the dates on the page Reports » Progress Summary » Custom Dates. In the native version, the dates can only be picked from the Calendar. Now you can enter or edit them manually - the input is no more blocked.

    If there find another place with the date picker, where the input is blocked, let me know, I will try deblocking it too.