I discovered an HRV bug after the February update when I had Instinct 2s. I then thought that was what did it.
Over time I've discovered it tends to strike maybe 4-5 days after I come down with a virus or other illness. HRV nightly average goes up way above the actual average when looking at the graph for that night. Sometimes the average is higher than the highest 5m value.
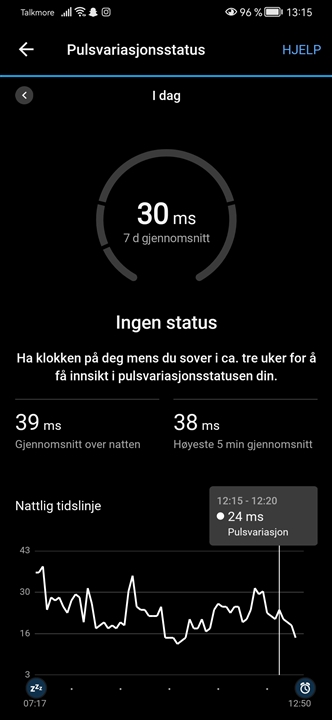
Then I got the 255s Music. Right after I started getting the dotted white line I got a really dramatic spike. Because of how Garmin watches calculate nightly average, you will get a very wrong average for that night if you happen to get a spike of that kind (which can happen if you're up for a while).
Now, I believe the bug struck again at that point because the watch didn't have more than a few days of averaging to look back on instead of weeks. And with that spike, even a normal HRV looked to the watch as similar to when HRV went down because of a virus.
This bug has continued to crop up regularly since, and spikes too.
That makes status and dotted line completely unusable, because few of the nightly averages are actual averages.
I need the ability to edit nightly average to get out of this and not have to create my own graph to get reliable data.
And it would be good to figure out why this happens.
I had a long discussion with a support specialist at the Instinct forum, but now this is spanning two watches. He said then that it wasn't a wide spread fault. To which I replied that most people don't check the graph, so how would they even discover this bug? So it could be wide spread and nobody would know.
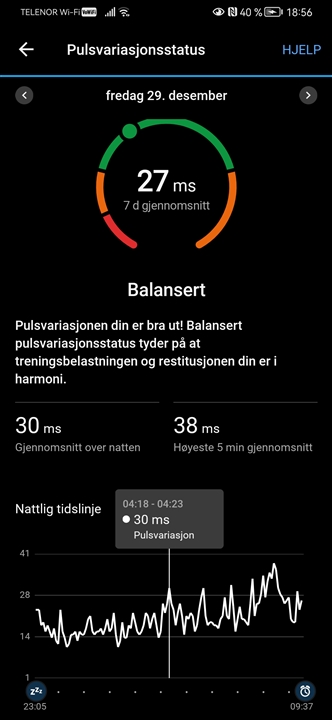
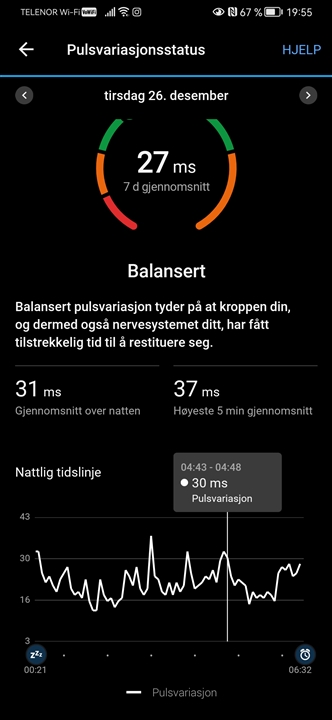
If you get a virus or other reason for HRV to go down for more than three days, could you check your nightly graph and see if the average it calculates is the actual average?
Egregious example of how maddening it can get when the bug strikes. These kinds of results are rare, but wrong average is more common.