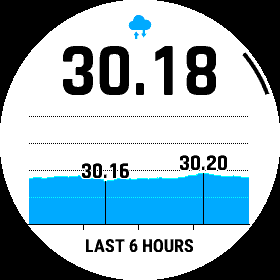
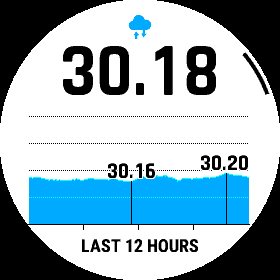
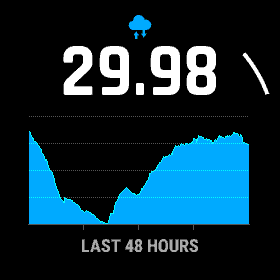
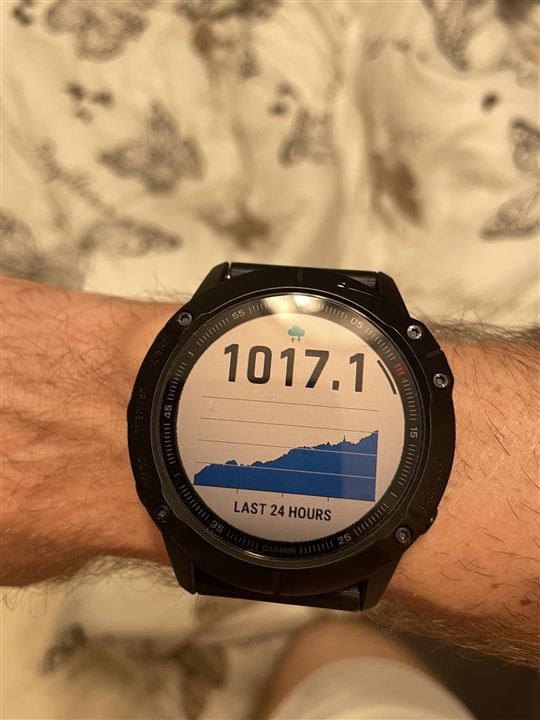
First I had wanted to report that although for the time scale of 6 and 12 hours there are 'auxiliary' values to 'explain' the scale for the axis Y, but there are no values for the time scale of 24 and 48 hours. And it must be a bug.
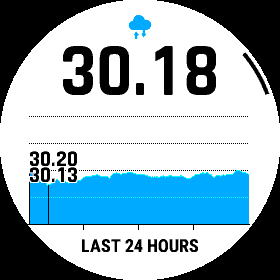
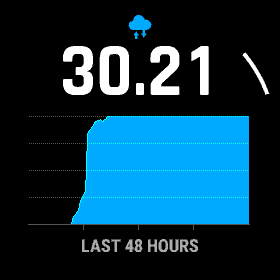
Butnow, when I had the time to report it I checked it again, and I saw that at that time there are already 'auxiliary' values for the time scale of 24 hours, but still not for 48 hours.
Is there anybody around who can advise me whether it is a bug or is there any logics behind? I mean when the auxiliary values are displayed and when not.