[DataField] Total Ascent / Decent Gauge

There is a datafield called "Total Ascent/Decent Gauge" which you can see at the top of my picture.

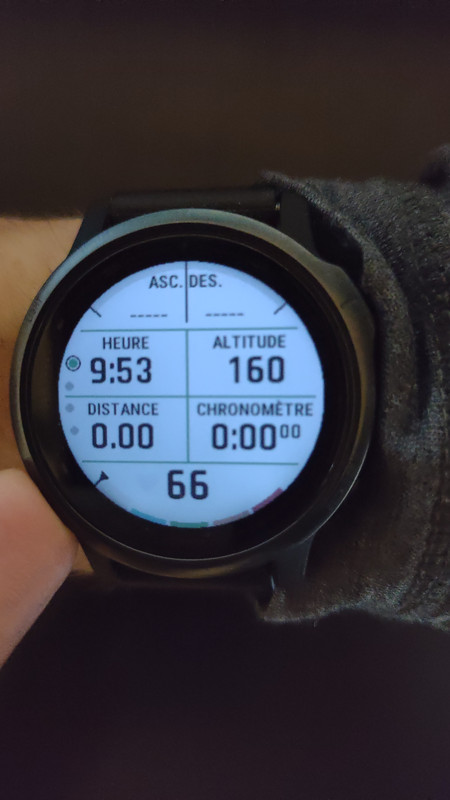
The user manual only gives the description of the text fields but there is nothing related to the gauges (graphical part):

Total Ascent/Descent Gauge "The total elevation distances ascended and descended during the activity or since the last reset"

It is composed of:

  • 2 text fields :
    • Total Ascent : The total elevation distance ascended since the last reset / during the activity
    • Total Descent : The total elevation distance descended since the last reset / during the activity
  • 2 gauges which are empty (grey) when ascent/descent = 0 and grow to the left in blue for ascent, and to the right in red for descent

My question is: what is the criteria for the gauges to reach 100% ?

When you are navigating or following a track, I would guess that it indicates the progress over the total elevation (positive in blue and negative in red).

I did try on a quick hike but without any navigation or track activated (so the watch did not know where I wanted to go) and the ascent gauge reached 100% when I reached to top of the hill, which sounds like magic... But I do not believe in magic so... Is it based on your last hike ?

Does anyone use this datafield and managed to understand on what criteria the gauge maximum is set ?

  • I use it and not 100% sure how it works. I assumed that the red bar(ASC.)goes with your floor target and the blue bar(DES.) accordingly using the same target but with steps descended. The numbers in each one are the total altitud you have ascended o descended. I'm speculating here..... 

  • I use this datafield too and just look at the numbers so never really gave the gauge much thought.

    Now that I consider it, including the fact I use it mostly for activities not using courses, I wonder if the gauges try to give a quick visual sense of how much climbing or descending that needs to be done to reach net zero (assuming you are starting/ending at the same point). So for your example, if your activity was purely uphill to the top of the hill, the ascent gauge would have shown 100% the entire way and then on the way down the descent gauge would start building up towards 100% which would be reached at bottom.

    Just guessing here, though, and hope someone from Garmin chimes in to clarify.

  • The 2 gauges showed 0% when starting the activity.

    Then the ascent gauge slowly grew up when walking uphill.

    It reached 100% at 50m elevation while the descent gauge was still at 0%.

    I tried to climb a bit higher and the ascent gauge remained at 100%.

    Then going downhill, the descent gauge grew up until it reached 100% when the loop was closed.

    So I would tend to agree to the net zero for the 2nd gauge, but the first one seems to be targeting something else.

    It could well be the "floor target" but if it is the case theses gauges are useless...

    I would hope it is linked to some sort of total ascent goal determined by either a navigation target or a course.

    If Garmin staff is reading this, please enlight us...

  • I'm hoping to do a routed trail run this weekend so (as I have this field on all my activities) - I'll see if course wise, it's related to total elevation for the course.

  • Maybe it works correctly only when navigating a course or track? 

  • After paying more attention to this in recent activities (without using courses), whichever direction (ascent or descent) has more accumulation will be shown as 100% while the other one then shows the gap remaining to reach net zero.

  • After paying more attention to this in recent activities (without using courses), whichever direction (ascent or descent) has more accumulation will be shown as 100% while the other one then shows the gap remaining to reach net zero.

    That's been my experience, as well. I really like using this gauge, I've always used it on my main screen on every GPS activity.

  • This also what I have noticed after several tests:

    - The 2 gauges start at 0%

    - The first gauge reaches 100% after 50m delta elevation (ascent or descent)

    - Then the other one shows the gap remaining to reach net zero

    - If the 2nd gauge end up with more accumulation, then the first gauge starts regressing to always show the gap

    I find this behaviour interesting when not using courses.

    Unfortunately it also behaves in the exact same way when using courses.

    Which in my opinion is much less interesting than showing the % of total planned ascent/descent.

    The gap to reach net zero only has meaning for a "loop" activity. But for a one way activity (itinerance / thru-hike / expedition...) it has no meaning at all.

    Is this forum the good place for making such a suggestion to Garmin devs ? Or is there a more direct channel ?

  • when following courses you can add the "Ascent Remaining" fields if that information is useful to you. 

  • Yes for sure we can always add more datafields to match the exact needs.

    But I was hoping for a "smarter" datafield which bring more information with the gauges than what we can already read from the text fields.