

Environment
- Connect IQ Developer Dashboard, Statistics tab (Versions view)
- App: SportClimb Tracker (Device App), developer BeOeS
- App ID: e651c50a-8af6-4fbc-b58e-6a0c5928857d
- Date range viewed: Aug 6 – Aug 12, 2026 (7 Days view)
- Browser: Brave (Chromium) on macOS
Problem
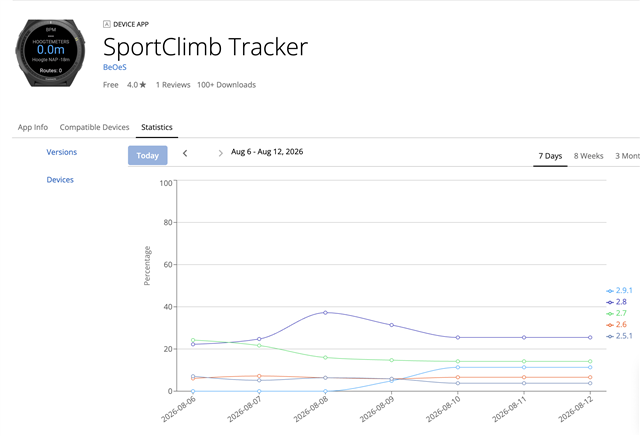
The version distribution graph under Statistics > Versions is flat for the last few days: from roughly Aug 10 onward, every version line (2.9.1, 2.8, 2.7, 2.6, 2.5.1) reports exactly the same percentage on each consecutive day, with no variation at all.
This cannot reflect reality, because I uploaded a new app version in this period. After a new version is published I would expect the share of the newest version to rise and the older versions to decline as users update. Instead the values are identical day over day, which suggests the statistics are no longer being refreshed and the last known data point is simply repeated.
Steps to reproduce
1. Log in to the Connect IQ Developer Dashboard.
2. Open the app page for App ID e651c50a-8af6-4fbc-b58e-6a0c5928857d.
3. Select the Statistics tab, then the Versions view.
4. Select the 7 Days range (Aug 6 – Aug 12, 2026).
5. Observe that all version lines are perfectly horizontal for the most recent days.
Expected behaviour
Daily version distribution figures are updated each day and reflect actual installed-version shares, including the uptake of a newly uploaded version.
Actual behaviour
The most recent days show identical values for all versions, i.e. no new data appears to be processed. The same flat pattern is visible in the Devices view / other ranges as well.
Additional information
- The new version itself is published correctly and is installable from the store; only the reporting appears to be affected.
- Screenshot of the Statistics graph attached.
- Please let me know if you need the exact upload timestamp of the latest version or any additional account details.


