
Do/Design It Yourself Data Field.
Disclaimer:
Application has hundreds of use-cases due to fully user-configurable setup, therefore it is prone to bugs. This project is not sponsored and I'm the only developer working on it in my own free time. Although I'd gladly accept reasonable criticism and improvement suggestions, I do not guarantee that bugs will be fixed and new features added in a timely manner/at all. If this approach is not acceptable for you, then, please, do not leave bad reviews just because I didn't resolve your specific case. Thanks for understanding.
Preface:
There's a lot of things custom activity recorders can do, which native Garmin apps cannot, but sometimes there's no need to invent a bicycle if there's one already itching for a ride. Some capabilities like local watch personal records, structured workouts information and advanced running dynamics will most certainly never be exposed to ConnectIQ API layer, therefore it's sometimes more efficient to use native software, but no one prevents us to use it with a twist. The main idea of this data-field type application is to give user a tool to design his own data field layout in WYSIWYG manner. The web application makes that possible providing cross-platform compatibility at the same time the only requirement being the HTML5 compatible browser. This app is not considered to be an ultimate DF which "replaces them all" as there's always something new and intriguing, which developer may envision, but I hope that this data field will help new and existing users to explore the Garmin ConnectIQ capabilities providing some unique features, which I didn't encounter in existing apps.
First things first: there's a web application, which allows to design data field layout and produces configuration string as a result. This configuration string can only be delivered to data field using standard settings means i.e. you will need either Garmin Express installed on compatible PC or Garmin Connect Mobile on your mobile device. Web app uses HTML5 local storage, changes are saved after each user action, therefore it's safe to leave your work half done and proceed from the same point sometime later. I do not own hardware to test with Apple devices, therefore any problems in that department can be explored and fixed only by sending me detailed explanations and, of course, the configuration string itself. Current version with the default layout setup was tested for several weeks in simulator and for several of my personal runs proving to be rather stable to go live, but of course there's no guarantee that this app will function without hitches on your specific device. Currently, I do not have a reliable hosting for my personal web apps, therefore data field designer will reside on Google Apps Engine servers using free account bandwidth/limitations (as there are almost no server-side computations, I think this will suffice for a while) at least if/until it'll become popular enough for the users to complain about page availability. Current implementation with the default layout setup works on the edge of stability and there was also a price to pay during watch code optimization, which lead to efficient but very unreadable code. This means that for older devices there may be no improvements, only bug fixes. But for modern devices like Forerunner735XT and on we still have additional 10kb of available memory, which can be used for new logic like new data values and/or additional app parameters (e.g. waypoints). Sometimes network latency and/or Google servers accessibility seems to impact resources load time and wrong font may be displayed first time the web app is started, to fix this simply press F5 (refresh page) in browser.
Current settings are 4 lines for definition itself (these should be copy/pasted without changes directly from web app), Target Pace for pacemaker values (should be entered as string in <min>:<sec> format, e.g. "5:40" as in min/km) and Milestones, which are just fixed distances comma separated list, they are expressed in kilometers and may contain fractional values using dot delimiter (e.g. 0.5,1,1.5, etc). It'necessary to enter values in kilometers, but they will be converted before display depending on watch settings.
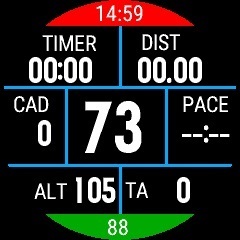
Default setup is considered to be a "component showcase" and consists of basic building blocks:
- Data values, which are simply text representation of corresponding activity information bits like time or speed, for data values it's possible to change screen coordinates, font, color, number of samples to smooth the value over specified amount of seconds and add optional outline for data to become more readable or dynamically colored on less contrast backgrounds; if text font is selected, then it's also possible to append data value with custom text, e.g. create label with value for another data block;
- Data graphs, these are just rolling data value charts, which represent one selected data value over a set period of time, minimum and maximum graph values are adjusted automatically, number of samples is calculated automatically based on width of graph area and graph bar, all of the other options are similar to data values;
- Graphics elements, these are basic graphical primitives, which allow to customize the layout, add visibility to some values etc; parameters for these elements are mostly self explanatory except for two specific elements of type Arc. These may not only serve as a static view elements, but also can be used to represent a dynamic data value in a manner of a progress bar. For this to happen you need to tick the "Variable" option and select base Data value (currently there's only a limited selection, but this may be a subject to change) accompanied by min and max initial values, these range values are indeed initial as when the underlying data value falls outside of this range, then range is adjusted automatically. For example in bundled layout this feature is used to display the progress to the next kilometer: Elapsed distance is selected as a base value, initial range is specified as 0 to 100 (in this case 100 means 1000m, as the distance values are displayed as 00.00), which means that this arc will grow from start angle to the maximum width angle as the elapsed distance increases during activity acting as a progress bar to the next kilometer. When elapsed distance will become greater than 1000 meters, then ranges will be readjusted using the same range difference as before, in this case minimum value will become 1000m while maximum one will increase to 2000m. Here's a little demo of what you can make using variable value arc (this config is created for semi-round devices, copy/paste this configuration string into import window of web app).
AGUAJA[HIWaVFAJNATXDEAODZQVELEUA[HIWaVFAODU]`DEAOEOQVEVE_A[HIWaVFAABG`[DEAOFDQWE`FHA[HIWaVFAABHGRDEAOF[QWFIFRA[HIWaVFAJNA\ODEAOGQQVFSF\A[HIWaVFAOE]CPCWAODZTMELF\A[HIWaVFAAAAAACWAPDWTMELF\ASADILDAPOE]CPFEABAVDVENQAPQAAAFDJCFACB
Selected element options can be adjusted using the properties panel to the right of the designer canvas. In addition to pixel-by-pixel adjustments, designer canvas allows to drag currently selected element. To drag data value it's not necessary to start drag at any specific point, but for graphs and graphical elements the drag point will be determined based on mouse pointer coordinates: e.g. to resize graph area or rectangle click and drag somewhere around the lower right corner, to adjust the radius of circles and direction arrow start drag outside of the outer radius, to change coordinates - click somewhere near the circle center. For the arcs it's currently possible to change start angle and arc width by activating drag-and-drop near the corresponding arc vertex. Touch support for mobile devices is implemented.
There are still some limitations like direction arrow points only to north or some data values available only on high-end devices like power are not yet implemented etc, but as I already mentioned above, this app is subject to improve especially for the newer devices, where there's a lot of memory available even for the data field type of app. The web app is also meant to be improved especially in a direction to provide the nearest possible WYSIWYG snapshot of what you'll actually see on device, but there are also some limitations like, for example, font, which is used as numeric font in the latest Fenix5/FR935 models is not and won't be publicly available (confirmed by Garmin officials explicitly) and I used nearest lookalike, therefore there still may be some couple of pixel differences here and there between device and web app. For these kinds of problems I can only test and fix using the user-provided layouts in specific device simulator as I'm a simple FR230 owner for real testing and I'm afraid this won't change in the nearest year unless generous users will help me to upgrade.
Web app may eventually become mobile application based on the user feedback (but not for the Apple devices, Android only).


