



Hi everyone,
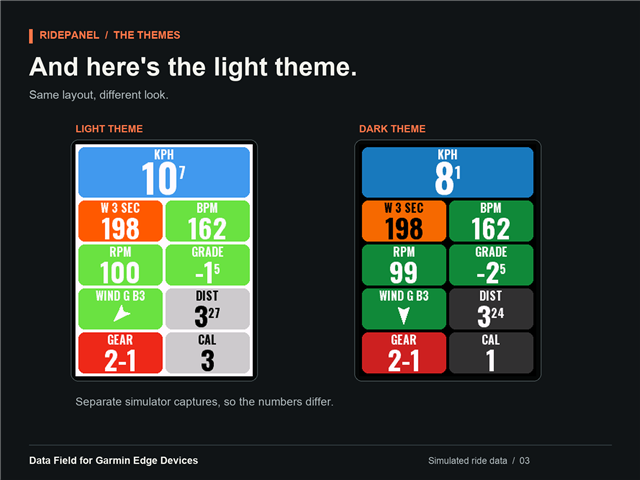
I'm the developer of RidePanel, a Connect IQ data field that brings your cycling stats together on one full-screen page. It uses large numbers and colored panels, with a choice of layouts depending on how much information you want to see.
RidePanel is completely free.
Download RidePanel from the Connect IQ Store
Features
- 5, 7, or 9 panels: Choose your layout and assign a metric to each panel, including the larger panel at the top.
- Cycling metrics: Speed, 3-second power, heart rate, cadence, grade, distance, ride time, elevation, ascent, descent, and more.
- Dynamic panel colors: Power colors follow FTP-based zones, heart rate uses your configured zones, and other metrics such as cadence and grade have their own color ranges.
- Light, dark, and automatic themes.
- Metric and imperial units.
Getting started
- Install RidePanel from the Connect IQ Store.
- In your Edge activity profile, add or edit a data page and select a full-screen layout with one data field.
- Select RidePanel from the Connect IQ data fields.
- Open the RidePanel settings to choose your layout, metrics, and theme.
RidePanel needs the whole page; it does not display the dashboard in a split-screen layout. Metrics such as power require the appropriate connected sensor. Unavailable readings appear as --.
Check the store listing for compatible Edge models. The screenshots below were captured in the simulator using sample ride data.
Feedback and support
I'd welcome feedback on the layouts, readability, and color choices. Feel free to post questions or report issues in this thread. If something isn't working, please include your Edge model, RidePanel version, and what you were doing when it happened. A photo or screenshot would help too.