
IQ Store link
https://apps.garmin.com/en-US/apps/1e85e2bd-72a0-47c8-b353-f1e19ecdd94c
Description
Edge Power Ride is a data field application for Garmin Edge devices that displays almost all popular ride metrics in a single screen, including advanced power metrics, like normalized power, intensity factor and training stress score. The app is configurable via Garmin Connect settings and supports different averaging periods for grade and power. Also, the app enriches activity FIT files with many useful charts and metrics visible when browsing completed activity via Garmin Connect Mobile/Web (disabled by default since, in some rare cases, it may cause an app crash. May be enabled via the "Enable FIT contribution" option in app settings).
Appearance
Features
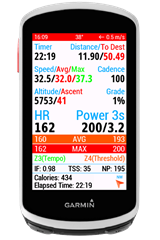
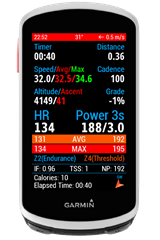
Datascreen fields
- Top bar
- Clock. Supports both 12h and 24h formats.
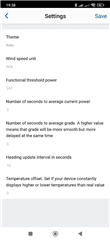
- Current temperature from the internal sensor with a 5-minute update interval. Supports both Celsius and Fahrenheit units. Additionally, there is a possibility to set a temperature offset if your device constantly displays higher or lower temperatures than the real value.
- Wind data (phone connection with mobile network and geolocation enabled is required). Displays current wind bearing and speed. Wind speed can be displayed in m/s, km/h, mph, ft/s and kn units.
- Timer time with 1-second precision.
- Elapsed distance with 2 digits after comma precision. Supports km and mi units. Distance to destination is an optional field and displayed only when the navigation mode is enabled.
- Current, average and max speed with 1 digit after comma precision. Supports km/h and mph units.
- Current cadence in rpm.
- Current altitude and total ascent. Supports m and ft units.
- Current grade in percent. Pre-filtered via the Kalman filter to avoid noise in altitude and distance measurements. The number of seconds to average grade is configurable via app settings. A higher value means that the grade will be more smooth but more delayed at the same time.
- Current heart rate in bpm.
- Current power in W and power-to-weight ratio in W/kg. To display the power-to-weight ratio, your body weight must be set in the Garmin Connect user profile. The number of seconds to average current power is configurable via app settings.
- Average and max heart rate and power during the ride.
- Heart rate zone based on data set in your Garmin Connect user profile. Displays one of the following values:
- Z1 - Active recovery (colored in grey)
- Z2 - Endurance (colored in blue)
- Z3 - Tempo (colored in green)
- Z4 - Threshold (colored in orange)
- Z5 - VO2 Max (colored in red)
- Power zone based on functional threshold power set via app settings. Displays one of the following values:
- Z1 - Active recovery (colored in grey) - 0-55% of FTP
- Z2 - Endurance (colored in blue) - 55-75% of FTP
- Z3 - Tempo (colored in green) - 75-90% of FTP
- Z4 - Threshold (colored in orange) - 90-105% of FTP
- Z5 - VO2 Max (colored in red) - 105-120% of FTP
- Z6 - Anaerobic capacity (colored in pink) - 120-150% of FTP
- Z7 - Neuromuscular (colored in purple) - 150+% of FTP
- Normalized power, intensity factor and training stress score to assess training load in real-time.
- Total calories burned during the ride.
- Total elapsed time (including pauses) with 1-second precision.
- Current heading as one of 8 cardinal directions (N, NE, E, SE, S, SW, W, NW). To avoid unnecessary frequent recalculation, there is an app setting that sets update interval in seconds for heading.
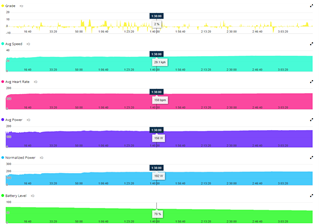
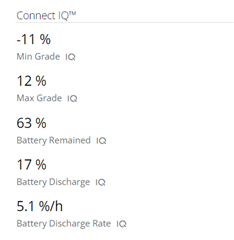
Additional data on Garmin Connect Mobile/Web
- Charts
- Grade
- Avg speed
- Avg heart
- Avg power
- Normalized power
- Total ascent
- Battery level
- Activity summary metrics
- Min grade
- Max grade
- Battery remained
- Battery discharge
- Battery discharge rate
How to change application settings
Changing Connect IQ App Settings
Supported devices
- Garmin Edge 1030
- Garmin Edge 1030 / Bontrager
- Garmin Edge 1030 Plus
- Garmin Edge 1040 / 1040 Solar
- Garmin Edge 1050
Price
The app is freeware.
