*Breaking* (at least I think so)
-> only for cycling and large devices (Edge 1030 and 1040 series).
Have you noticed (pro) riders with a piece of paper taped on their stem? To indicate where to drink, where to attack, where mountains are? Or to just have a motivational picture?
Now is the time we do not have to do this anymore! With current large devices as the Edge 1030 and 1040 series there is enough room for a digital ‘StemSticker’ and 2 normal fields. And of course you can just swipe to another screen with different fields.
Check out the (old school) StemStickers of Matthieu van der Poel in Flanders 2022, Fabian Cancellara in Paris-Roubaix 2014 below and compare them with screenshots of the StemSticker datafield:
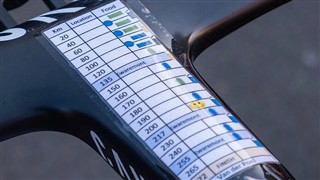 (Matthieu van der Poel in Flanders 2022)
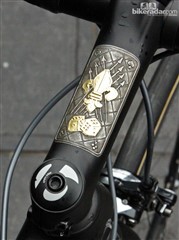 (Fabian Cancellara in Paris-Roubaix 2014)
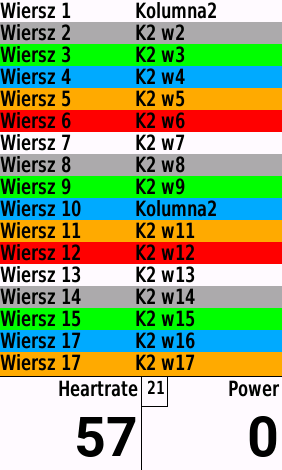
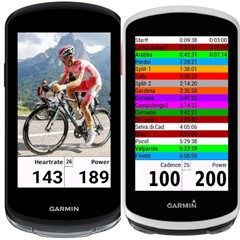 (My new datafield: Stemsticker, who need a piece of paper in these digital days?)
So let us dive into the StemSticker datafield (just uploaded, so needs some time before it is approved).
You will have to spend some time in the settings to have it your way.
First, select fields to be shown bottom left and bottom right. You can choose from several fields. For the Power field you can select to show 1s, 3s or 10s average.
Now you can select the picture you want to include. Currently there is only choice of 3 fixed pictures. In future I am planning the feature to have the user use his/her own picture. The pictures on the 1030 series have a ‘bezel’ because of memory limitations of these devices.
Now you can set the amount of seconds you want the picture shown and the table shown. If you only want a picture, fill in zero for the table and the other way round.
Next up is to create your own table. The table consists of 17 rows. Each row has 3 columns. You can select the text for the 17 lines of the first column and the 17 lines of the second column. A time can be input as text.
You can select what you want to be shown in the third column of the table: lap-average or lap-time. Each time a lap has finished the column will be updated with this number.
The idea is that for a GrandFondo you can put text and targets, see my example for the Maratona dles Dolomites above.
Finally you can select the color of each line of the table. White and blue like Van der Poel did, all colors like in my example, all-white, anything you like.
Roadmap from now:
1) ‘some time’ (2 weeks) for bug fixing and small feature requests
Probably I missed something, users will react, I will correct.
Probably there are small whishes that are easily fulfilled, I will do so.
2) Concurrent: room for pictures that users want to be included.
If there are too many, we can have a vote.
3) ‘after some time’ (2 weeks) I will start coding the option to get your own picture loaded.
Be aware, I am a lousy programmer, this will take me months. Training goes first!
If you have any suggestions, please let me know.
If you like the app, please give it a positive review!
Now hopefully even happier training for you all,
Kind regards,
Sir5 (Sirfive for Garmin)