
Hi all together, perhaps you can help
Im running in out of memory with my watchface with latest SDK 3.0.3
Many settings are implemented and the peak memory on settings changed is becoming more and more with every SDK Version.
I have check this with the same operation (change the same settings) and different SDK's with follow results:
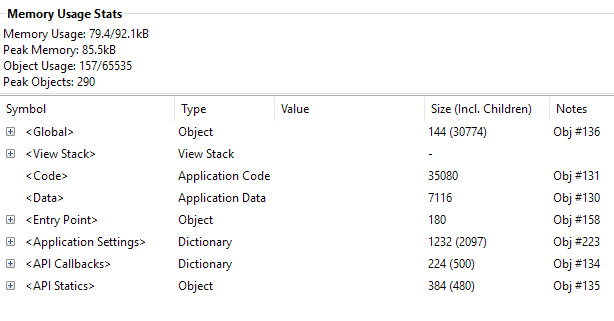
SDK 2.4.9
Memory Usage: 79.4/92.1kB
Peak Memory: 85.5kB
Object Usage: 157/65535
Peak Objects: 290
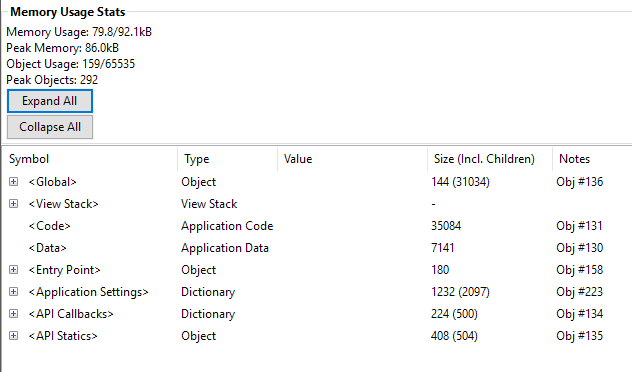
SDK 3.0.1
Memory Usage: 79.8/92.1kB
Peak Memory: 86.0kB
Object Usage: 159/65535
Peak Objects: 292
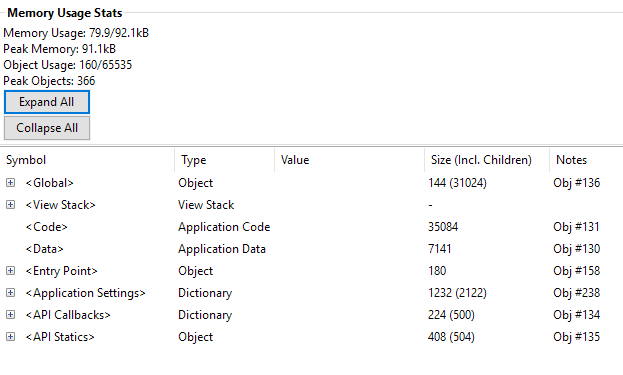
SDK 3.0.3
Memory Usage: 79.9/92.1kB
Peak Memory: 91.1kB
Object Usage: 160/65535
Peak Objects: 366
I can't migrate to SDK 3.0.3 without reducing the functionality.
But why does the Peak memory increase so much with latest SDK.
community.garmin.com/.../1404817.png community.garmin.com/.../1404818.png community.garmin.com/.../1404819.png


