What are "API Callbacks" in the memory view, and how can I reduce them?

hi,

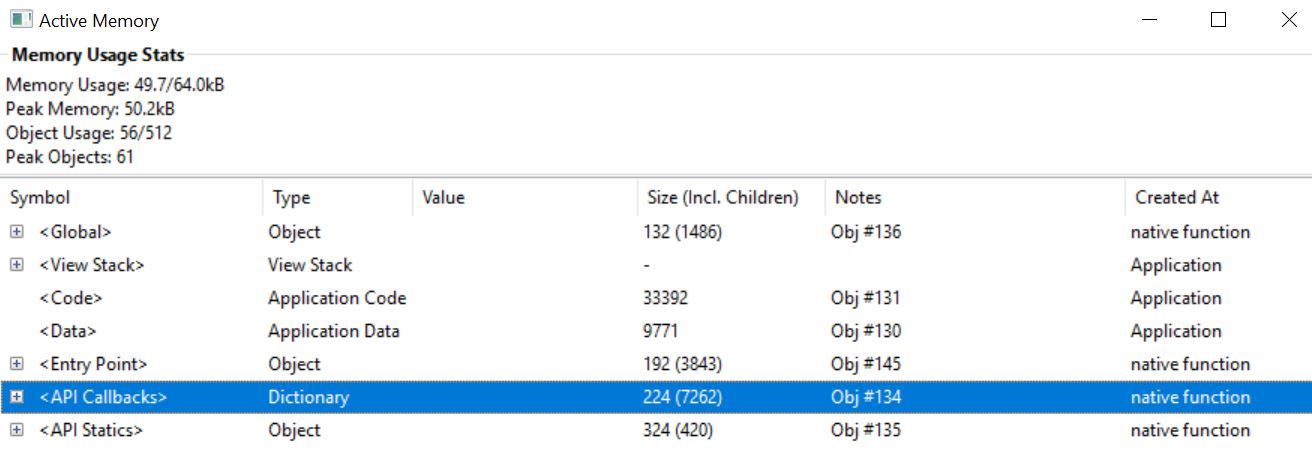
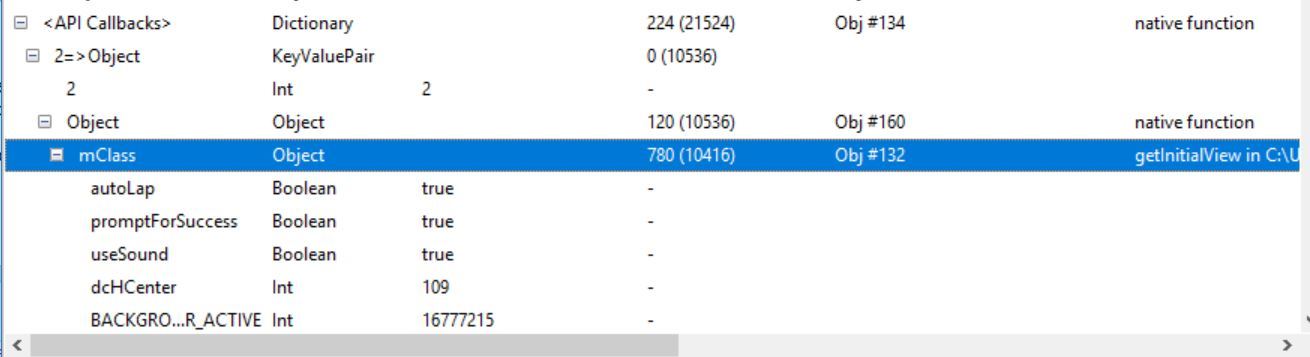
My app's memory is pretty close to the limit, and in some devices users got "Out of memory". Looking at the memory view in the emulator, what are the "API Callbacks" as seen on the attached screenshot, and how can I reduce them?

Thanks! community.garmin.com/.../1380765.jpg
  • Callbacks are used for a number of things, and since this is created by "native function", there's likely little you can change. While I'm not sure exactly how and what this is used for, callbacks in your code could be set with things like a timer, makeWebRequest, positioning, sensors,etc, This might also be used for things like onUpdate etc - things called by the VM...

    If you're looking to reduce memory, the best place to look is in your own code and data.

    Based on your screenshot, you're peak usage is about 50k, and your app has a max of 64k. Both those numbers can change based on the target you're simulating, the version of the SDK, etc. Are the users getting "out of memory" on the same or similar devices? Which app type is this?
  • Former Member
    Former Member
    The API Callbacks section is, as Jim speculated, the callback objects saved by the system when you register callback methods for things like timers, or sensor data.

    These are generally pretty small, but some entries can be large. For example, if you use the Sensor data listener to receive real-time accelerometer data, the streaming data is accumulated in the object that is part of the API callbacks dictionary between callbacks. The size of this object can be minimized by requesting less samples per callback.

    Generally there will be little you can do to affect the size of this object other than reducing the number of registered callbacks.
  • Thanks for the explanation!
    I'm indeed registering sensor callback:
    Sensor.setEnabledSensors( [Sensor.SENSOR_HEARTRATE, Sensor.SENSOR_TEMPERATURE] );
    Sensor.enableSensorEvents( method( :onSensor ) );
    And in onSensor I'm reading the HR, temperature and altimeter. I tried now to remove temperature but it didn't reduce the mem usage.
    I'm also registering a Timer callback.

    My app type is Application. I was able to reproduce the "Out of memory" issue on the emulator when using an lower SDK, and now also on an actual device (Fenix 3), though some people got it much quicker than I did (when they started the app vs opening a few screens). On an actual Fenix 5 (and in the F5 emulation), there seems to be much more mem available and indeed didn't encounter an issue on that device for example.
    Code + API Callbacks is 40k, and didn't find something significant I can remove, which leaves me very little to play with. I guess I'll have to disable some features and screens on low mem devices (?).

  • If you are recording a .fit file in your app, the f3 is a bit interesting in that as soon as you start recording the session, it grabs 4k of memory. the original vivoactive grabs 1k, while other devices don't grab any.

    So on a f3, with recording, your max memory is really 60k and not 64k.

    in order to save memory, you could comment out the call to enableSensorEvents (that's where you're setting the callback), and then triggered by the timer call Sensor.getInfo(). you might save a tiny bit.

    Yes, the f5 has about 124k for a device app, while an f3 has 64k. And a f5+ has 1275k, BTW....

    There are a few recent threads here about reducing memory.. You might save a bit by using dc calls vs layouts, floats vs doubles, etc. If you are using bitmaps,maybe look at reducing the color palette... A number of things together could free up some memory.

    So maybe just doing your data a bit differently, for example. And with Jungles, you can adjust functionality to the device in the same app, so have fewer screens on an f3 than on an f5.

    When looking at the main sim window, the numbers are the bottom are the idle memory and max, so make sure to watch the peak memory in "View Memory". And keep an eye on object usage there too.
  • Thanks again for the explanation.

    Indeed I forgot to mention that I'm recording .fit file, and also 7 extra fit contribution fields. Together they take ~8.5k.
    Looking again at the API callbacks usage, I think I was wrong - inside, it has a pointer to the view registered the callback, and it doesn't really take memory beyond what that view already allocated, even though the size (inc children) looks large. So they probably take just a few bytes after all? See mClass in the attached screenshot.

    Removed a few redundant classes and that seems to get the mem to an ok spot (60k / 64k), but beyond that I'll use .jungle to have fewer screens and features on F3, and will also add less fit contribution fields on that device, since I want to add more features that for sure will get it too close to 64k...

    community.garmin.com/.../1381156.jpg
  • Former Member
    Former Member
    I actually wouldn't expect too much data in the API Callbacks section for setEnabledSensors() and enableSensorEvents(). The real-time accel data, which accumulates in that object is registered using registerSensorDataListener()

    You are correct about the view. I did not think about the method objects in there being large. If the class that is registering for callbacks is large as you see here, it will appear in the callbacks section, and could be duplicated for each callback.

    You have to watch out for double counting in the "inc children" section since an object might appear more than one place in the memory viewer.