I'm wondering what really accelerometer data, more specifically what means the x, y & z values...
Is it speed of movement along the axes values ? or acceleration values ? Positional values measuring orientation of the watch with respect to gravity vector ?
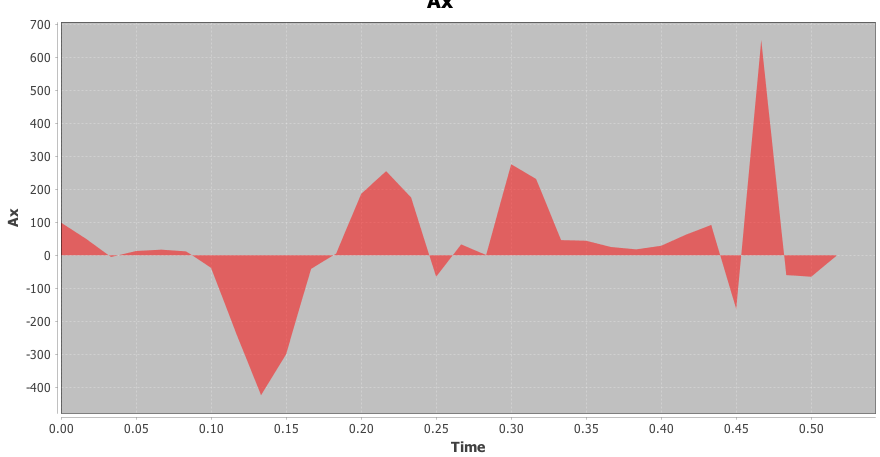
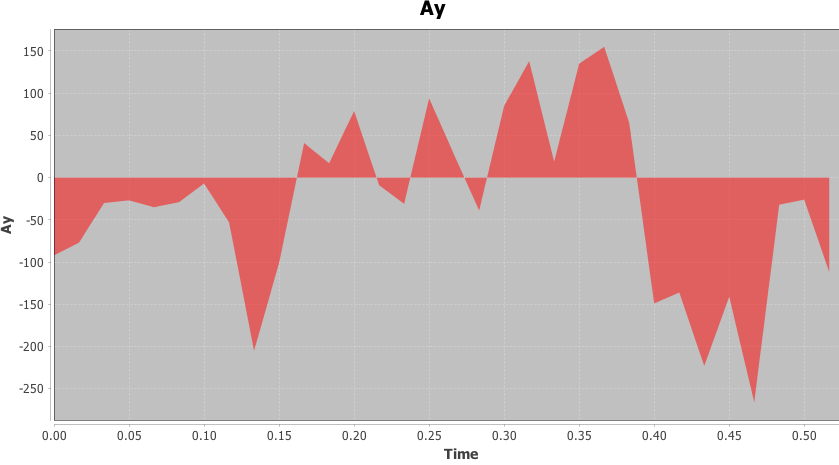
I have tried to record x, y z at regular interval when doing some basic movements but I don't understand what I get with respect to my movements...
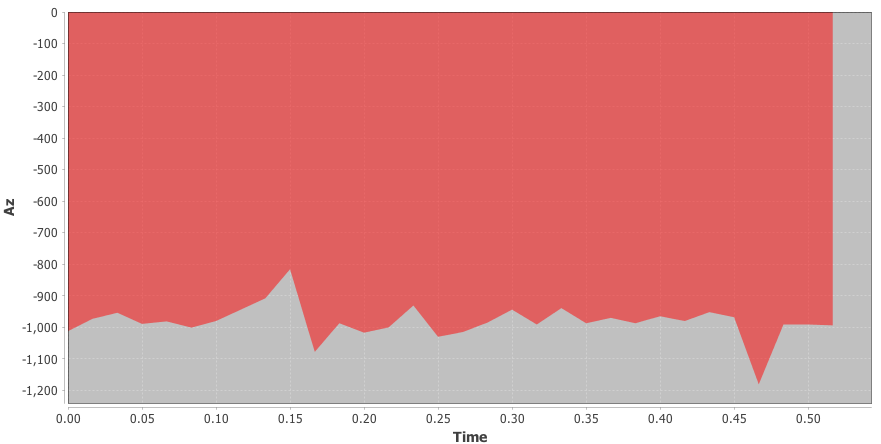
Other poitns are strange. While I have positive and negative values for x & y, the z value is always negative (around -1000)
I join3 picture of the accelerometer values during a 32s activity doing movement un different directions with my arm...
If someone can help me or orient me with a clear definition of the values returned by the accelerometer community.garmin.com/.../1310283.png community.garmin.com/.../1310284.png community.garmin.com/.../1310285.png