
Because I was curious about the performance of my app I used the profiler and tried to pin down a bottleneck I noticed something weird:
When my app is making calls to the native Toybox.Application.Storage method setValue() it displays it as deleteValue() instead of setValue().
I've set up a quick test-app and this is the result:
import Toybox.Lang;
import Toybox.System;
import Toybox.WatchUi;
import Toybox.Application;

class profiler_testMenuDelegate extends WatchUi.MenuInputDelegate {
  function initialize() {
    MenuInputDelegate.initialize();
  }

  function onMenuItem(item as Symbol) as Void {
    Storage.setValue("test", "this_is_a_test");
  }
}
and the output of the profiler:
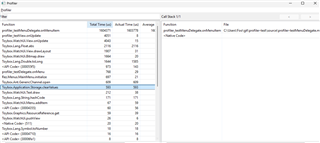
Can anybody confirm that this is a bug or am I missing something?
To me it should clearly display a method call to setValue() and not clearValue() nor deleteValue().
Time for another meaningless bug report if I'm on the right track.

