Discussion about gear calculator data format for graph

I nearly finish my gear calculator datafield. Yes, there is already some, but non of them know what I like. 

One of my idea is save the calculated front and rear gear information into the FIT file for a late analize or whatever. But the graph can show only one number, and I am not sure, what is the best number. I ask the AI Smiley and it suggested that I thinking about earlier, so not better idea.

Let see my possible ideas for the numeric value:

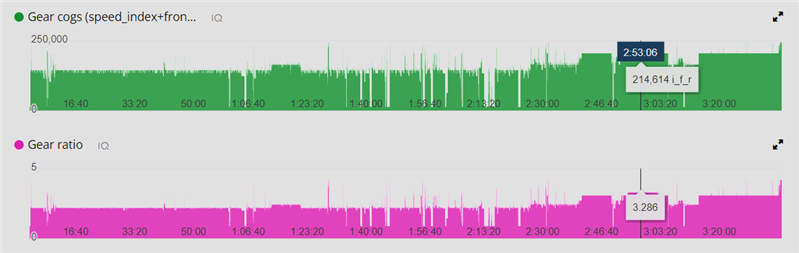
Combined total speed gear like on a 2x12 system a number from 1-24. Maybe ordered by ratios or simple one chainring&cassette gears after the another.
Its good, when the calculation is jumping between the chainrings (the ratio is fit for more combination) there is no big jump here it ratio ordered but there is no visual information about when I change chainring.

Gear ratio Float number. Also nice continuos shifing even if the ratio jumping, but there no information at all about the real shifter position. Maybe a 3th part program can use it and count back to chainring&cassette position.

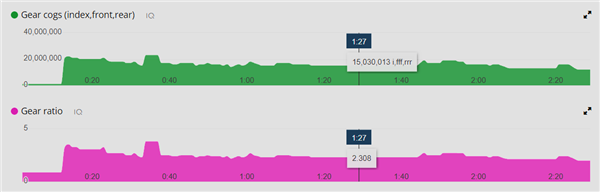
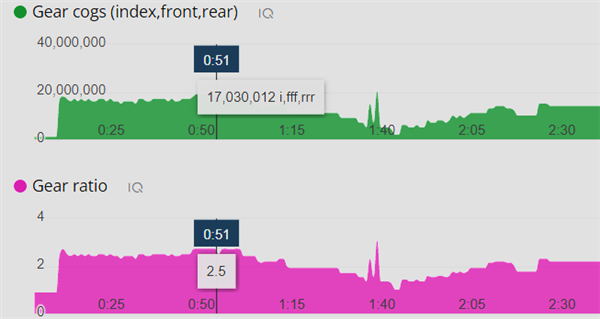
Combinated chainring&cassette position in one number. What I mean, the 101 means 1. chainring 1 cassette. 309 means 3. chainring 9. cassette. etc.

Combinated Ratio & chainring&cassette. Just like before but add the ratio like ratio*1000 . chainring&cassette. e.g.: 125.205  means 1.25 ratio , 2. chainring 5. cassette

What you thing about it? Maybe a better idea, or what is your favourite from them?

  • Well, there are at least 2 things you can do in Garmin Connect.

    Either you can overlay 2 graphs

    or maybe in the web version you can move on the map and see the other graph's value is moving with that. 

  • I am not happy with my idea about the combinated index and gear cogs. The problem is the number decimal formatting in garmin connect. They did a thousand separate, so it just cut the first gear to half. Just like on the screenshot.

    2214,614 means 21 - 46 - 14 (speed index:21, first gear: 46, rear gear: 14) If I put in a float, the garmin sometime make a large number from it like 21.4614 -> 21.4613453564354662. I really have no good idea for the shifters that is looks ok and informative enough.

  • Then you could easily use that to your advantage: 

    speed index:21, first gear: 46, rear gear: 14 => 1000000 * speed_index + 1000 * first_gear + rear_gear. With some luck it'll be displayed like: 21,046,014

  • Good idea, I try, thanks!

  • I think its ok, No better idea and this is readable well. 

  • If someone interested about my final solution, here is the app:

    https://apps.garmin.com/hu-HU/apps/2a7a7c61-410a-46f3-a60a-6b7d04372652

    and the graph style that I choice: speed no: 17, front: 30 cogs, rear: 12 cogs, this is for humans. And the ratio in the separate graph for compare or any other using. Thanks flocsy for the good idea!

  • Szép!
    Maybe give the user an option to choose what format they prefer. Looking at the screenshot I think I as a total beginner would prefer to see a similar display to what I would see on the shifters: instead of the cog count, the index of the cogwheel. i.e f:[1-3] r:[1-8] so for each data point it would be something like 1.001.008, 2.001.007, ... 24.003.001
    Another way to confuse some people (I guess) is which is #1 the small or the big cogwheel? Is it the same for the front and the rear?... Maybe it's overcomplicating, but with a good default, but possibility for the more advanced users to change the way they like them to be indexed can make it more useful.

  • Yeah I thinking about what is better, the index or cog, but I dont want to over complicate this :) There is still one of the most complicate config page.

    The smallest-largest index is indrustry standart, just like in the car, the first always the slowest, easy. Also it is in the manual display styles part: README.md