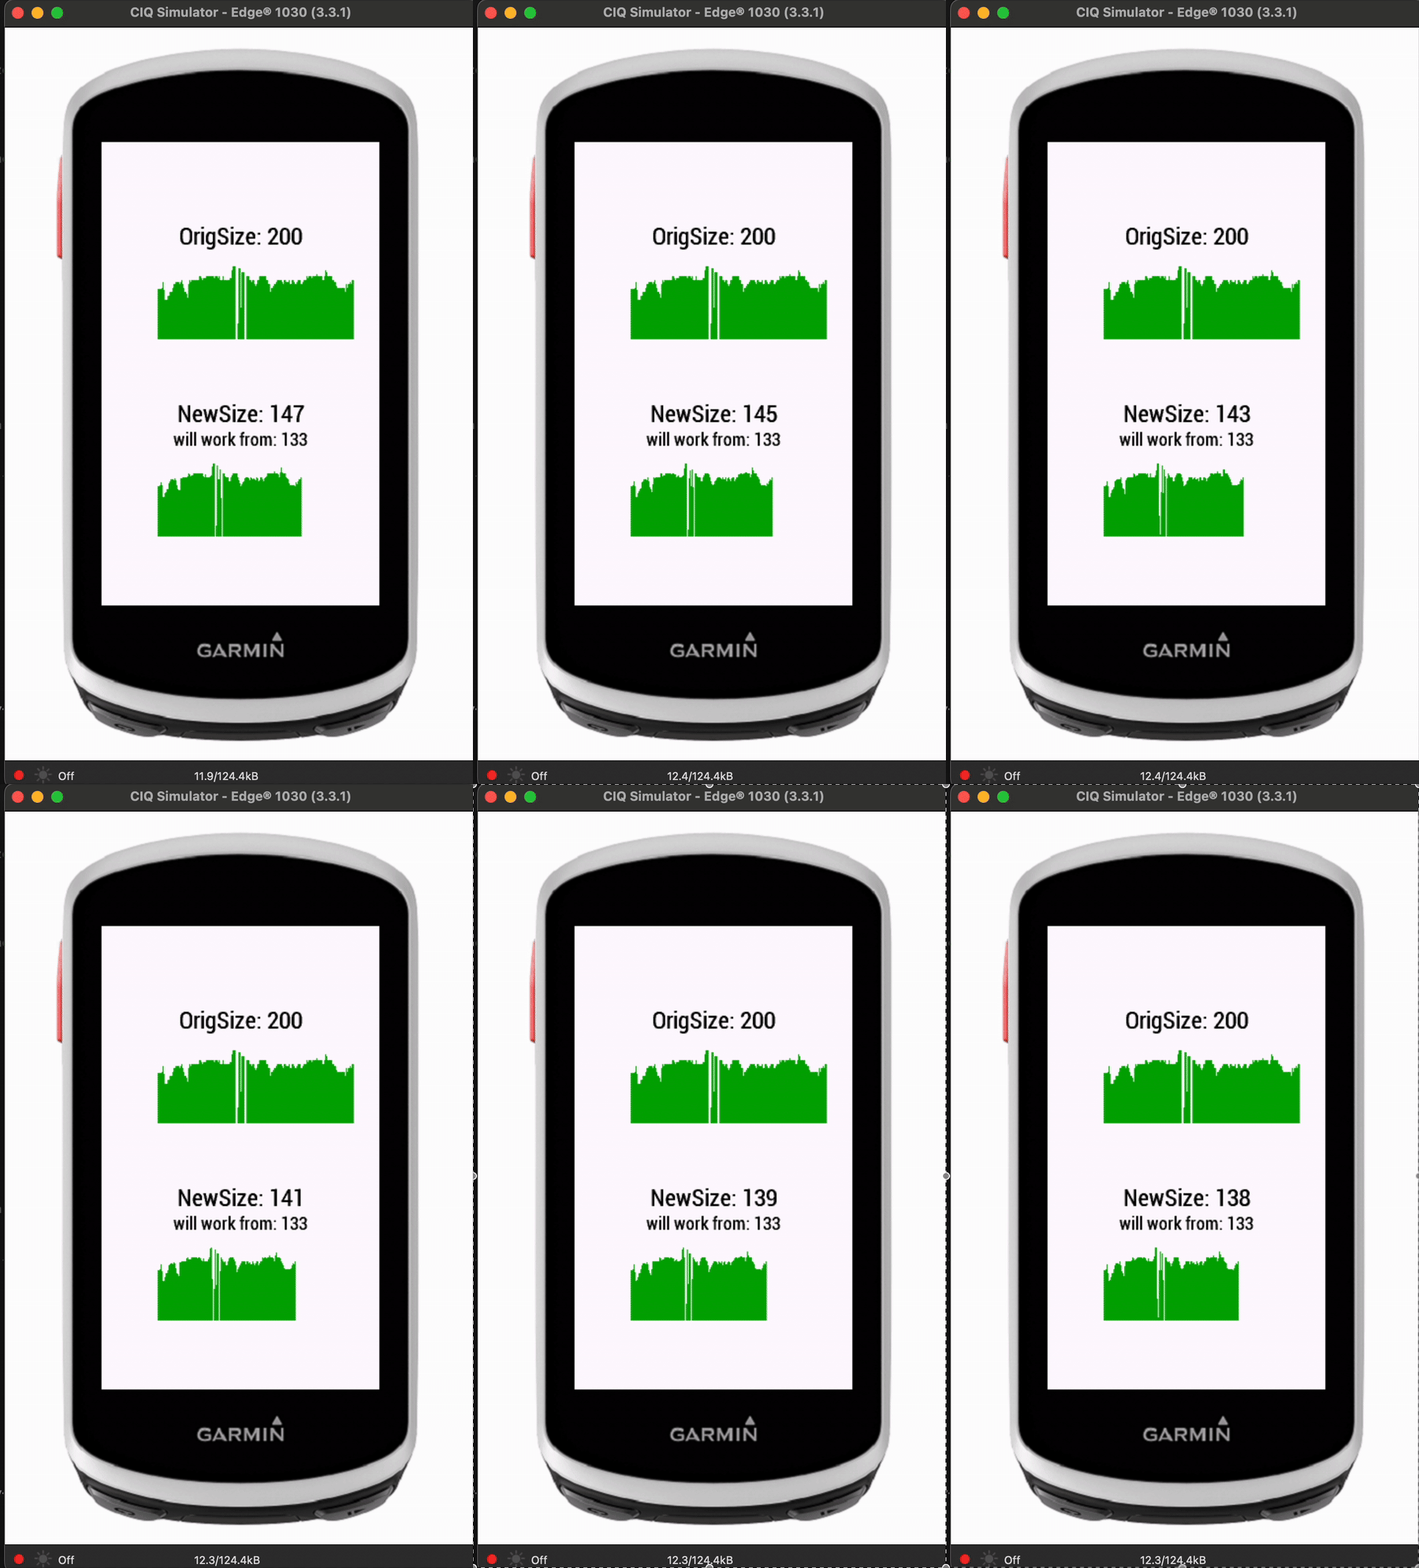
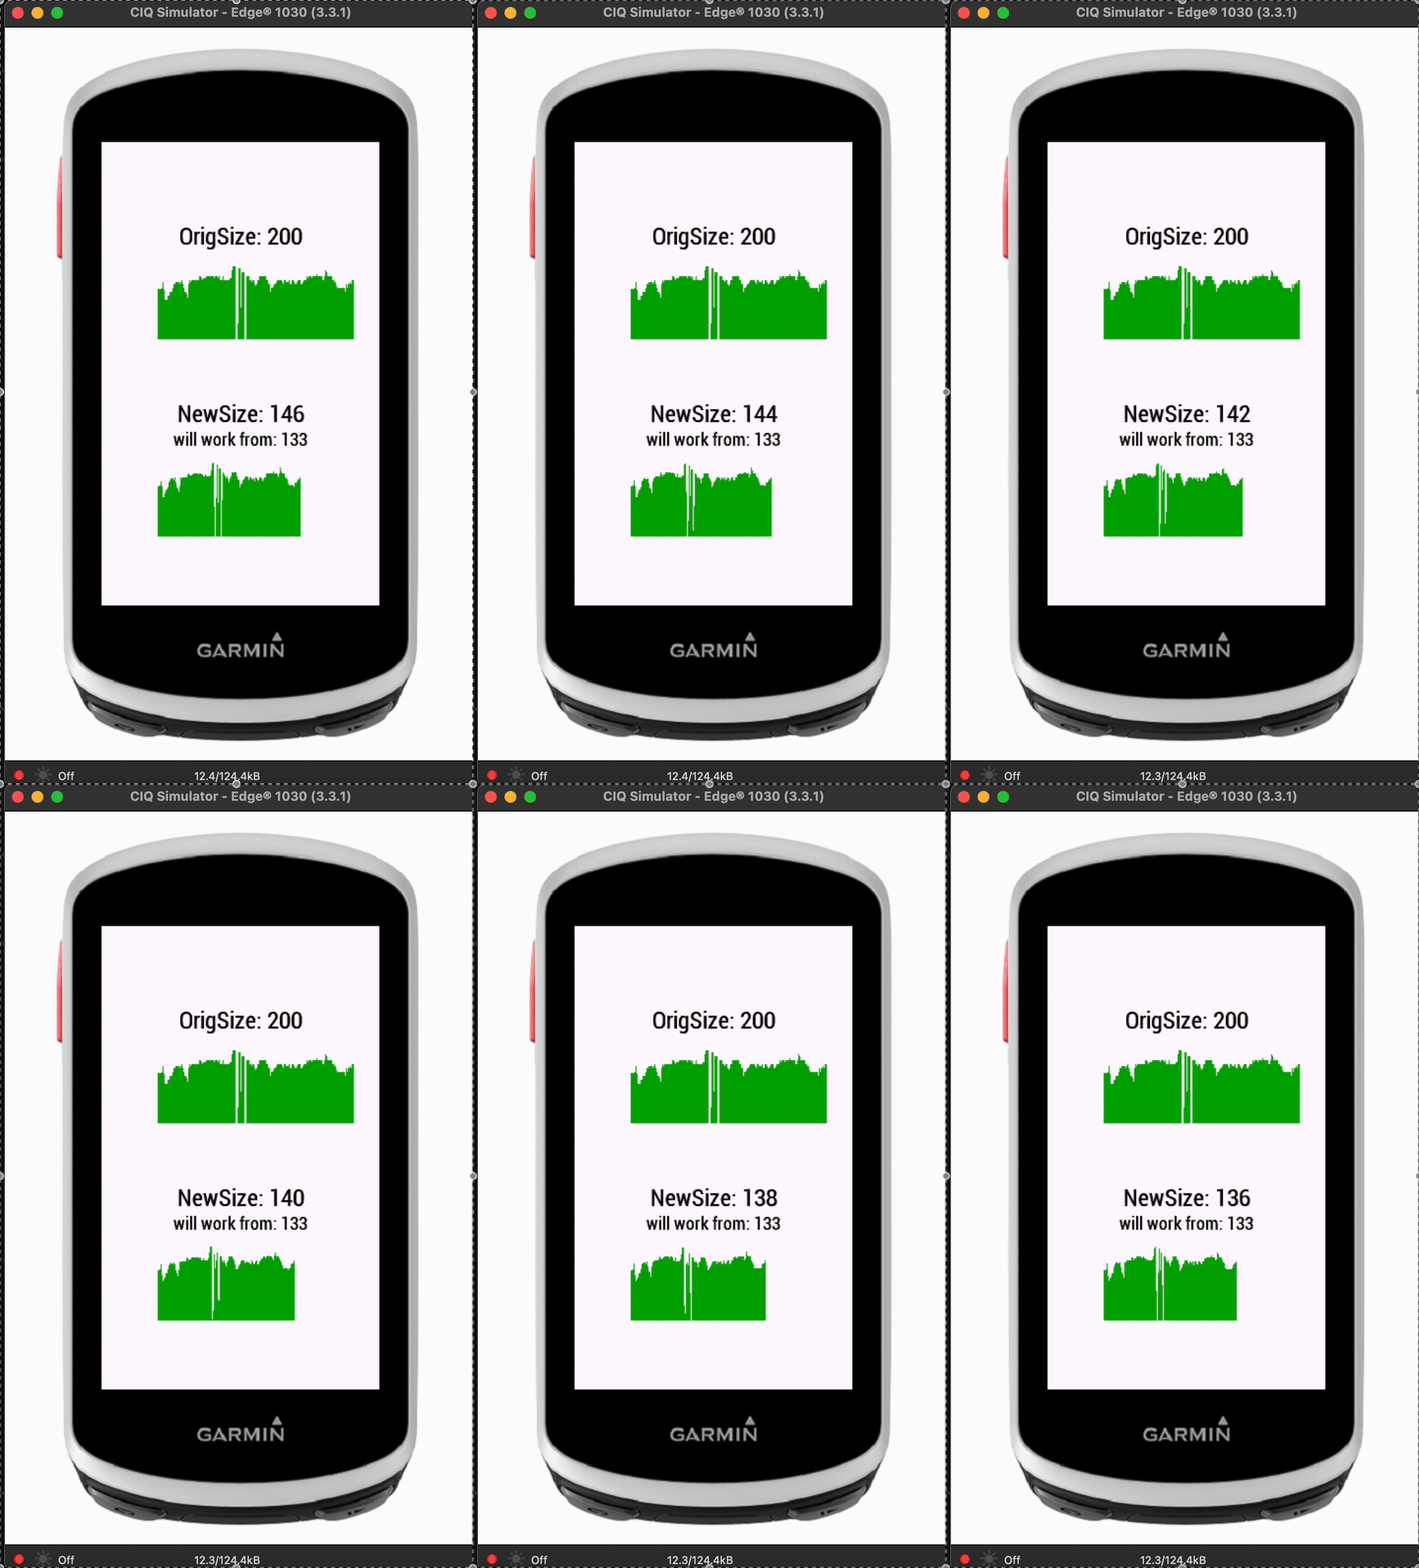
Without wanting to hijack the neighboring thread on the topic of Array.add(), this topic brings me right to my current brain teaser:
I have a data field that shows the rolling average graph for a certain period of time. A user has asked me not to make the graph a rolling average, but rather to show the complete activity. Problem: the duration of which is of course unknown. At first, I thought I could solve this with array.add(), but after studying the neighboring thread, I now want to do it this way:
Let‘s assume:
-it‘s about elevation
-to keep it simple: at the beginning - each second a new value
-the width of the graph is 240 pixel
At the beginning, I fill the graph from right to left. After 240 seconds, the graph is complete. I use an array with 240 elements for this.
Then a new value is to be added at the right edge. Now the previous 240 values at the left must be reduced to 239 and the new value becomes the [0] value. So I have to average/edit 240 values in such a way that the original 240-wide graph is compressed to a width of 239.
And I have to do this over and over again so that the elevation graph always show the entire activity. However, for the new value[0] at the right edge, an increasingly larger average elevation value must be formed over time, because each pixel of the graph represents a larger time span over time. However, this is easy to accomplish and not the problem.
My problem is: How can I turn 240 values into 239?
I'm racking my brains, but I can't find a solution for how to implement this.
Or is there a completely other way to handle this?


