Maximum .PRG file size error

I am trying to recompile one Application from github from one watch model to another. When I build it I get this error

ERROR: PRG generated exceeds the memory limit of app type 'watch-app' for device id 'instinct2x': 218282 bytes.

What does it exactly mean? Is it max file size of prg file 218282 bytes or it is bigger than maximum allowed by 218282 bytes or what?

When I build it I get 363980 bytes prg file.

Can I find somewhere the list of max oprg files for each watch?

Also, how can I decrease the size of prg file? Maybe change SDK version or some compiler option?

  • I think I found the main reason that the app is so much bigger for CIQ 3 vs CIQ 4.

    It seems that in CIQ 3 devices, statically initializing an array takes a huge amount of code that's proportional to amount of the data in the initializer. In the case of TAMA_PROGRAM (a byte array), the code impact seems to be roughly 13X the amount of data. (I think that if it was an array of 32-bit Numbers, the code impact would probably be 13 / 4 = 2.5X)

    In CIQ 4 devices, the same array is initialized with a smaller amount of data (seems to be the exact data in the initializer + 30 byte overhead for the array itself).

    TL;DR The runtime size of TAMA_PROGRAM is only 12,303 bytes (regardless of device)

    on CIQ 3.0 devices, the code (in PRG) for TAMA_PROGRAM is ~160,000 bytes! (13X the size of the runtime object)

    On CIQ 4.0 devices, the data (in PRG) for TAMA_PROGRAM is very close to 12,303 bytes (the size of the array at runtime).

    If we can figure out how to efficiently encode TAMA_PROGRAM for CIQ 3.0 devices, we might be able to get it to run on instinct2x.

    Maybe the solution is to chop up TAMA_PROGRAM into multiple parts, to get around the huge overhead having both the JSON resource in memory *and* the decoded array at the same time, when the resource is loaded and decoded.

    I'm going to try it out. (I'll also have to try to fix the "const OPS" code, which causes an out of memory error on instinct2x even if the TAMA_PROGRAM array is never loaded)

    Unfortunately another problem is that the watchdog timer will be tripped on fr945lte (and it probably would be on instinct2x as well), meaning that we'll have to chop up the execution of code as well. (i.e. break up long running operations into multiple pieces)


    Details:

    For example, I wrote a test app with the following code/data usage:

    no array:

    instinct2x (CIQ 3.0) code = 226, data 636

    instinct3* (CIQ 4) code = 173, data 365

    global byte array with 100 members:

    instinct2x (CIQ 3.0) code = 1541, data 644

    instinct3* (CIQ 4) code = 173, data 495

    --

    For CIQ 3 devices, adding a 100-byte array causes the memory usage (via code) to balloon by 1325 bytes!

    For CIQ 4 devices, adding a 100-byte array causes the memory usage (via data) to increase by 130 bytes

    --

    It does explain why moving the array to JSON resources helps. But unfortunately, this probably means that the memory hit is at least temporarily 2X as much as the array-in-code case, because when you load a JSON resource, the API probably has to load/keep the JSON resource in memory at the same time as it decodes the resource. The representation of the JSON resource in memory is probably bigger than the decoded resource itself (i.e. the byte array).

    With this in mind, I tried a couple of tests:

    - build on fr945lte, fake out the parts of the code that call getSubscreen. In this case, the app fails due to watchdog timeout (code executed too long). This is going to be a problem even if we can figure out how to initialize the big program array efficiently. 

    in this case, code = 202141, data = 15694

    - build on fr945lte, comment out TAMA_PROGRAM and all references to it. Comment out the code that actually starts the emulator

    In this case, code = 42260, data = 15396

    So for CIQ 3.0 devices, the code for TAMA_PROGRAM takes 160K. But at runtime, the size of TAMA_PROGRAM is only 12303 bytes.

  • Current progress on instinct2x (just testing stuff to see the impact of various changes, and the feasibility of continued efforts):

    - cut out TAMA_PROGRAM (remove completely and temporarily take out code that uses it; also disable starting the emulator)

    - cut out OPS array

    After those changes:

    code = 33695

    data = 12456

    memory =  84.2 / 91.8 kB (7 KB free)

    Unfortunately there's no way to fit the 12,303 byte TAMA_PROGRAM byte array into 7 KB, no matter how we load it.

    TODO:

    - somehow find enough free memory for both OPS and TAMA_PROGRAM (this will require lots of hand-coded optimizations - not even sure if it's possible)

    - initialize/encode OPS as efficiently as possible

    - load TAMA_PROGRAM as efficiently as possible (maybe chop it up into multiple JSON arrays)

    Once the compile-time and run-time out of memory errors are resolved:

    - chop up long-running emulator operations into multiple pieces (to avoid watchdog timeout)

    Tbh, I'm not sure if it's possible to cram this app into the 98304 bytes of memory that instinct2x has for watchApp. instinct3solar45mm has 131072 bytes of memory and even then, the app is right against the limit. (Total memory is 123.8 KB, peak memory is 119.2 KB).

    CIQ 3 issues aside, instinct2x just has weaker hardware / tighter limits (less available RAM, lower watchdog count).

    instinct2x watchdog count: 120000

    instinct3solar45mm watchdog count: 240000

    The 2X difference in watchdog count kinda suggests that instinct3solar45mm is 2X as fast as instinct2x, which means that even if you could get the app running on instinct2x, the user experience might not be so good.

  • I think I found the main reason that the app is so much bigger for CIQ 3 vs CIQ 4.

    It seems that in CIQ 3 devices, statically initializing an array takes a huge amount of code that's proportional to amount of the data in the initializer. The code impact seems to be roughly 10X the amount of data.

    Probably related to this item in the SDK changelog (7.0.0.beta1):

    Place constant array and dictionary definitions into the data space to reduce code space.

    Insane that the old way of doing things has a 1200% code/memory overhead.

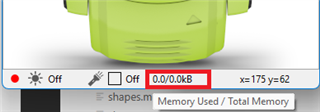
  • Actually, when I load this 12K array from JSON, I do not see how much memory is missing. Maybe if it is a small amount, then I can check how this 12K array is used and optimize this. Also,  there are some duplicates in array (around 1 hundred elements sequentially are the same). When the simulator crashes with out of memory I cannot see real memory usage as it says 0/0kB in status bar like this

    How can I get the real memory usage just before the crash or debug it somehow?

    I will put 

    System.getSystemStats()


    and print into the logs total and free memory everywhere, but maybe there is a better way to do it?

  • Depending on the type of crash, you may still be able to use the memory viewer: File > View Memory.

    You can also "cheat" and artificially increase the memory limit in ConnectIQ/Devices/instinct2x/compiler.json, to avoid the out of memory error (simply for the purpose of seeing how much memory is actually used). I think this hack only works for runtime memory issues, not compile time memory issues. Ofc it is no help when running the app on a real device, but it can help you diagnose and fix out of memory issues in *some* cases.

    As I said above, even if you can figure out how to load TAMA_PROGRAM without issues, you still have other hurdles:

    - avoiding out of memory issues when initializing Ops

    - somehow saving at least 30k of memory to account for the available memory difference between instinct3solar45mm (131072 bytes) and instinct2x (98304 bytes)

    - avoiding the watchdog timeout (which would likely require writing *more* code) EDIT: actually no, this is the easiest thing to fix

    Even if you can do all of that, it's not clear whether the performance would be acceptable on instinct2x.

  • This is the stack trace and error which I got.

    Error: Out Of Memory Error
    Details: Failed invoking <symbol>
    Stack: 
      - <init>() at D:\Data\workspaces\garmin\garmin-gotchi\source\tamalib\private\cpu_pvt.mc:1480 0x10001c46 
      - <init>() at D:\Data\workspaces\garmin\garmin-gotchi\source\tamalib\private\tamalib_pvt.mc:34 0x100028c4 
      - <init>() at D:\Data\workspaces\garmin\garmin-gotchi\source\GarminGotchiApp.mc:34 0x100000b1 
      - 
    Native code0x80000000 

    because it happens during the variable declaration, I cannot put a breakpoint and print/see the memory status.

    Artificially increase the memory looks like a good trick, which will help me to understand how much I need to save. I will try it later.

  • This is the stack trace and error which I got.

    As I mentioned already, it is running out of memory during the initialization of the Ops array (cpu_pvt.mc line 1480). This will happen even if you remove TAMA_PROGRAM completely (as I said above). I suspect the code is not even getting to part where you load the resources.

    const OPS as Ops = [
        new Op("PSET #0x%02X ", 0xE40, MASK_7B, 0, 0, 5, method(:op_pset_cb) ), // PSET
    ...

    It's an array which contains 100 objects. As I I think I mentioned, there is a huge runtime overhead for objects in Monkey C, so it's not surprising that instinct2x would run out of memory here (since it has 30k less available RAM than the instinct 3 solar).

    This is part of what I was saying about there being multiple difficult challenges here.

    1) Optimize memory for TAMA_PROGRAM

    2) Optimize memory for Ops

    3) Somehow save at least 30K of memory (to account for difference between instinct2x and instinct 3 solar)

    4) Get around watchdog timeout (which probably means you have to write *more* code). EDIT: wrong, it's just a simple change of constant value

    I think there are 2 approaches you can take for the memory stuff.

    A) Just increase the memory limit in sim until you don't get an runtime out of memory error any more. (Like I said, I don't think this will cure any compile-time PRG memory limit, although you can get around that by compiling for fr945lte - but that will just add more issues since you have to get rid of the subscreen code)

    B) Comment out *both* Ops and TAMA_PROGRAM, and work on optimizing them separately

    You could also combine A and B.

  • As far as Ops goes, one approach could be to get rid of the Op (opcode?) class, which is just used for data storage anyway. Instead of putting all the data for a single opcode in a class, put it in an array.

    Pros:

    - you save a ton of memory per opcode (an empty array is 15 bytes, while an empty object [*] is 84 bytes. Since there's about 100 opcodes, you would save at least 6900 bytes with that change

    [*] not including Number, Float, Long, Double, String, Boolean, or Null

    Cons:

    - the code will be harder to read, understand and maintain. instead of accessing class members like some_op.code, you'll have to hardcode array accesses like some_op[1];

    --

    You could also get rid of the log strings (which are presumably only good for debugging). You'd potentially save another ~3 KB that way.

    e.g. 

    Old code:

    const OPS as Ops = [
        new Op("PSET #0x%02X ", 0xE40, MASK_7B, 0, 0, 5, method(:op_pset_cb) ), // PSET
        ...

    New code:

    const OPS as Ops = [
        [0xE40, MASK_7B, 0, 0, 5, method(:op_pset_cb)], // PSET
        ...

    (Obviously there's a lot more to it than that, but hopefully you get the idea).

    With this one conceptual change, you could potentially save 10 KB of memory that's used to represent the OPS array at runtime, and who knows how much more memory for the code that's used to actually initialize the array.

  • Speaking of the watchdog timeout issue, I was wrong above. It's very easy to fix. The code already supports limiting the amount of work that's done in a single "execution context" via the RUN_MAX_STEPS constant.

    I was able to avoid the watchdog timeout issue by changing RUN_MAX_STEPS from 160 to 80.

  • As far as Ops goes, one approach could be to get rid of the Op (opcode?) class, which is just used for data storage anyway. Instead of putting all the data for a single opcode in a class, put it in an array.

    I took a quick stab at this while building for fr945lte (CIQ 3.x device). I got rid of the Op class, and put each opcode definition in its own array (so that OPS is an array of arrays).

    - before: code = 201709 / data = 15494 / runtime size of OPS object = 33843

    - after: code = 204552 / data =12443 / runtime size of OPS object = 17079

    There's a big savings in data which is almost offset by a big jump in code (probably due to nested array initialization). Could probably save more memory by flattening everything into a single array.

    But there's a huge 16 KB savings in the runtime memory size of OPS, which is very promising.

    EDIT:

    After flattening OPS into a single 1d array:

    code = 203,118 / data = 12,443 / OPS = 14,919

    Total savings = 20,566 bytes

    Unfortunately I think we'd still need to find at least 10 KB additional memory savings to have any hope of squeezing the app into instinct2x, which might be tough if there isn't another big data structure to optimize :/

    Also, even after these changes, the memory usage in fr945lte is 346 KB, which is insanely high. It seems that the bitmap resources take up at least 100 KB in the app at runtime, for CIQ 3 devices. (For CIQ 4 devices, these bitmaps would be in the graphics pool, which is why they wouldn't have the same memory impact.)

    --

    I was able to save even more memory in OPS by getting rid of all of all the method() calls and just storing the symbols instead. (The object returned by method() is a lot bigger than the size of a symbol, which is basically an integer)

    (e.g. replace method(:op_pset_cb) with :op_pset_cb)

    code = 201903 / data = 12443 / OPS = 3255

    Total savings = 33,445 bytes (peak memory is 332 KB)

    So we actually can save ~30 KB, but unfortunately the app still uses about 232 KB too much memory. About 150 KB of this can be explained by the crazy overhead of TAMA_PROGRAM for CIQ 3 (but not CIQ4), but we're still left with at least 82 KB of bloat.

    --

    So to revise the "TODO list":

    - [EASY] Fix watchdog issue: easy, just change MAX_RUN_STEPS from 160 to 80 (for example)

    - [EASY] Optimize OPS array: get rid of classes, get rid of method() calls, and flatten everything into a single array - big 33 KB savings

    - [HARD] optimize the loading of TAMA_PROGRAM (clearly we can't initialize it via code, as there's a 150 KB overhead). (This is hard unless the idea of splitting TAMA_PROGRAM into multiple JSON arrays works.)

    - [HARD/IMPOSSIBLE] Save ~80-100KB of memory which is dedicated to bitmaps. I don't really see how this will happen, unless:

    -- not all bitmaps need to be loaded at the same time

    and

    -- there's a way to constantly load/unload bitmaps which won't make the app slow to a crawl

    The big issue here is that CIQ 4 devices have a shared graphics pool and CIQ 3 devices do not, meaning that loaded bitmaps count against the app memory for CIQ 3, but not CIQ 4.

    Like maybe the solution here would be to try to avoid bitmaps altogether, but instead draw some sort of simplified, efficient vector graphics via code? Even if it's possible, it might not look very good.

    To take this idea to an extreme, maybe the bitmaps could be replaced with plain text and/or emojis.

    EDIT: actually the bitmaps are 100 KB on a 64 color device like fr945lte, but only 20 KB on a 2 color device like instinct2x.

    20 KB is a lot of memory though, when you have none to spare.