CIQ 4.0 devices App Freezes several second on simulator with large JSON and Bitmap

Hi Team,

I'm experiencing a consistent and reproducible app freeze that occurs exclusively on the CIQ 4.0 devices. The same application code runs perfectly on the Fenix 6 Pro simulator and other older devices.


System & Bug Details

  • Device: Fenix 7 Pro (Simulator)

  • Connect IQ SDK Version: 8.2

  • The Issue: The simulator completely freezes for several minutes after any WatchUi.requestUpdate() is called. My debugging shows that my onUpdate() method completes successfully, and the freeze happens immediately after it returns, suggesting an issue in the system's rendering pipeline or Garbage Collector (GC).
    The freeze happens when a pageview with Bitmap is shown.


Key Debugging Findings

We have performed extensive debugging and have confirmed the following:

  • Simple apps work: Basic SDK samples and a minimal test app with the same core structure work correctly. This proves that drawing bitmaps or the general app structure is not the fundamental problem.

  • It is not the amount of free memory: We refactored the entire application to use a highly memory-efficient data structure ("Array of Arrays" instead of "Array of Dictionaries"), which cut the main data object's memory usage by over 50%. Memory dumps confirmed plenty of free memory. This refactoring did not solve the freeze.

  • The trigger is app complexity: The freeze only occurs in our full, real-world application, which has multiple views, loads several JSON and bitmap resources, and has a more complex object graph.


One strange thing I noticed comes from comparing the compiler.json files from the SDK:

  • Fenix 6 Pro watchApp Memory Limit: 1,310,720 bytes

  • Fenix 7 Pro watchApp Memory Limit: 786,432 bytes

The Fenix 7 Pro simulator is configured with significantly less memory for a watch app than its predecessor. This appears to be the root cause. While a simple app works fine, a complex app's total "weight" (even with low data usage) seems to put the Fenix 7 Pro simulator's memory manager or GC into a frozen state that it cannot recover from quickly.

Could the team please investigate this memory limit discrepancy for the Fenix 7 Pro simulator? It seems to be incorrectly configured and is making it very difficult to develop complex applications for this device family.

I am happy to provide the source code for the full failing app and the working minimal app to help with debugging.

Thank you.

BTW, the app I'm developing is a UltraTrail companion, if someone has a Fenix 7 or newer and want to test the app on real watch I'll gladly send the APP compiled for a Trail of your choice if a GPX track is provided.

Top Replies

  • I believe the memory limit you're seeing aligns with what's stated in the device reference. However, this can't be confirmed at the moment, as the reference link has been broken for some…

All Replies

  • I’ve observed a similar issue in the simulator, and it seems to be specific to SDK 8.1.x. I haven’t tested it with 8.2 yet, since there's another bug in that version that currently prevents my code from compiling.

    https://forums.garmin.com/developer/connect-iq/i/bug-reports/simulator-onupdate-delay-issue-with-sdk-8-1-0-and-8-1-1

    I believe the memory limit you're seeing aligns with what's stated in the device reference. However, this can't be confirmed at the moment, as the reference link has been broken for some time:

    https://developer.garmin.com/connect-iq/reference-guides/

  • I believe the memory limit you're seeing aligns with what's stated in the device reference. However, this can't be confirmed at the moment, as the reference link has been broken for some time:

    https://developer.garmin.com/connect-iq/reference-guides/

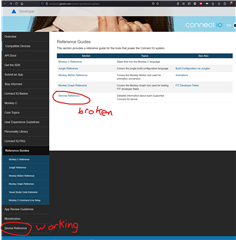
    They changed the url. A new link was added to the sidebar which works, but the old link (on the page you linked) doesn't work anymore. At least they finally split the device reference into one page for each device - previously it was one huge (static) page for all devices, which led to several issues.

    Here's the working url: https://developer.garmin.com/connect-iq/device-reference/ 

    And here's the locations of the broken and working links on the developer site.


    Here's the corresponding bug report, which you have already commented on: https://forums.garmin.com/developer/connect-iq/i/bug-reports/device-reference-page-is-missing 

    I'll just say that Garmin has been known to change URLs and break their own links in the past. e.g. Garmin still hosts some dev blog posts (on developer.garmin.com) which point to dead forum links (the whole platform was changed years ago, breaking all the links) or other dead links on developer.garmin.com.

    Also, I wouldn't read too much into the fact that the simulator / device config files are aligned with the device reference guide. I think it's likely that they're both auto-generated from the same source, along with the SDK API docs, so the fact that the contents are aligned may not necessarily suggest anything about their correctness.

    I also don't think it's that crazy that Fenix 7 Pro has a lower limit for watch apps / device apps compared to Fenix 6 Pro:

    - fr955 (CIQ 4) has the same limit as fenix7pro (also CIQ 4) and fr945lte (CIQ 3) has the same limit as fenix6pro (also CIQ 3). If it's a misconfiguration (which I doubt), it's not limited to just fenix7pro

    - Starting with CIQ 4, devices have a shared graphics memory pool for graphics resources (fonts and bitmaps), which is not counted in the app's memory limit / usage. Previously, graphics resources were loaded into app memory. This may be one reason that it was deemed acceptable to lower the memory limit for device apps

    - For fenix6pro, the watchApp limit of 1310720 is huge compared to the watchFace limit of 114688. Contrast with a weaker device like fr245 where the watchApp limit of 131072 is barely higher than the watchFace limit of 98304. So another reason for lowering the memory limit could be that that the previous limit was deemed to be unnecessarily high [*] (and perhaps they needed that memory for something else, like the graphics pool)

    [*] e.g. does Fenix 6 Pro really need the ability to run device apps that are 10X as complex as FR245? Does a device app on any given device really need more than 10X as much memory as a watchface? How many devs are making device apps that use anywhere near the 1310720 byte limit? 

  • Thank you so much for this information! It’s very helpful and confirms we’re seeing the same behavior.

    I have the same  behavior.on 8.2.1.
    reading what is saying about graphic pool, I have to add that the freeze happens only when the view to be shown has bitmap, and typically after the first show of the view, the freeze does not happens anymore.
    I guess it can be some issue in the new graphical pool model; object or bitmap Handling/Caching/etc..


  • reading what is saying about graphic pool, I have to add that the freeze happens only when the view to be shown has bitmap, and typically after the first show of the view, the freeze does not happens anymore.

    Tbh I kinda guessed something along those lines. I bet that on pre-CIQ 4 devices, all your resources are loaded at app startup, whereas on CIQ 4+ devices, they are implicitly loaded on demand (due to the graphics pool).

    To try to get around this, you could pre-emptively call BitmapReference.get() to force the corresponding resource to be "locked" in the graphics pool:

    https://developer.garmin.com/connect-iq/core-topics/graphics/ 

    Graphics Pool

    Since API level 4.0.0

    Before API level 4.0.0, all resources loaded at runtime into the application heap. This heap is used to hold your code, data, stack and runtime objects, so loading images could quickly limit the runtime functionality of your app. API level 4.0.0 introduced a new graphics pool that is separate from your application heap. When you load a bitmap or font at runtime, the resource will load into the graphics pool, and you will be returned a Graphics.ResourceReference. The graphics pool dynamically caches, unloads and reloads your resources behind the scenes based on available memory. All the drawing primitives that accept resource objects also accept references so your app should not have to be reworked to take advantage of the new system.

    Calling ResourceReference.get() on a reference will return a resource object. As long as the object returned is in scope, the resource will be locked in the graphics pool.

    Couple of things to watch out for:

    - you'll have to be careful about how many resources you lock at the same time, since the graphics pool is a shared resource. 

    - calling BitmapReference.get() could still cause a freeze, it's just that you would have greater control over when the freeze happens (e.g. at app startup instead of in onUpdate())

    If you have large numbers of bitmaps which are displayed at different times, it may be that just calling .get() on all of them at startup is not feasible (as this could interfere with other apps that need to use the graphics pool). If you can only ever lock a subset of the bitmaps you need, then this may not be much of a solution at all, as the app will have to freeze at some point (since CIQ is single-threaded, it's not an option to somehow load resources "in the background"). However, maybe it's possible for you to load bitmaps at some point where the user may not notice. (e.g. instead of loading them on a key press, tap or screen update, you could try loading them on a timer, although you'd obviously need some way of predicting which bitmaps will be needed in advance. This is still not a great solution since the user might very well decide to press a button or swipe the screen while you are loading the bitmaps.)

  • Thanks Flowstate, I did some more further test triyng to nail down the problem, and what I saw is that also with 1 small bitmap (24x24px png), I have freeze time that can be up to minutes. In the app I load a gpx track data from a JSON file, typically 1600 point, (I store it in an Array of Arrays). if I lower the number of points of the track the freeze reduce almost to 0 when I have less the 100 point. I'm now convinced that it can be a problem in object handling or something in that area.
    Meanwhile I'm trying to use load & reference as you suggested, but when freeze is very high user notice in any case..

  • Yeah it sounds like the problem is in loading the track data and has nothing to do with bitmap resources. If that's the case, it's strange that it only affects CIQ 4+ devices.

    If you are actually downloading JSON files from the network and somehow parsing them in your app when the user opens a certain view, it sounds like that is the cause of the problem. If so, I'd be surprised that the system isn't automatically terminating your app due to a watchdog timeout.

    Do you have more details about how you handle this data? (Where does it come from and how do you parse it?)

  • JSON is saved in resources and not downloaded from network (for the moment :) )
    It is loaded in a array of array in a Initialize() of a class dataview (where i have all data prep and calc.)
      

     System.println("U: "+ stats.usedMemory + " F: " + stats.freeMemory + " T: " + stats.totalMemory);          

               _masterTrack = Application.loadResource(Rez.JsonData.track);

    but on the Json load there are no freeze.
    later when I switch to a view that has Bitmap, I load resources:

    public function onLayout(dc as Dc) as Void {

                _miniProfileImage = Application.loadResource(Rez.Drawables.AltimetryProfile);

                _miniMapImage = Application.loadResource(Rez.Drawables.MiniMap);

                _aidIcon = Application.loadResource(Rez.Drawables.AID_Icon_24);

                _sectIcon = Application.loadResource(Rez.Drawables.SECT_Icon_24);

                _baseIcon = Application.loadResource(Rez.Drawables.BASE_Icon_24);

    also here no freeze. then I draw them on the screen in onupdate

    var icon = (type == "BASE") ? _baseIcon : _aidIcon;


    var verticalThreshold = 20;

        var iconHeight = 15;


        if ((baseY - profileY) < verticalThreshold) {

            var topY = baseY - profileHeight;

            dc.drawBitmap(x - 12, topY, icon);

            dc.drawLine(x, topY + iconHeight, x, profileY);

    but also here there are no freeze.
    the freeze happens after function end...