Hello,
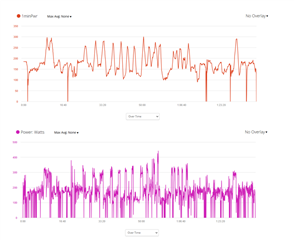
I am developing a datafield that measures a particular value, calculated using ten seconds of activity movement (incorporating distance and steps). The problem that I'm having has to do with graphing the (FIT) data on the Garmin Connect app. The data fluctuates too much, and jumps up and down excessively, to the point that the graph is hard to read, and makes my datafield useless. I need to smooth my data before saving it to the FIT file, so the graph is legible for users. But I don't know how to smooth the data effectively. To add a constraint for those who may be interested in helping but are unfamiliar with FitContributor data, due to how the FIT file is created & saved, the data must be updated every second, and it has to happen while the activity is underway.
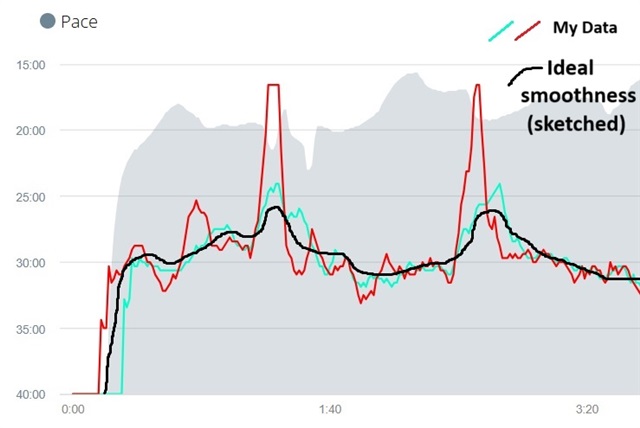
In my datafield, I maintain ten seconds worth of data in an array, and I've tried [method 1] coding my own 'simple moving average' en.wikipedia.org/.../Moving_average, to plot the average for each ten second chunk (which it does every second; perhaps that's too frequent sampling!?), and [method 2] 'linear regression using least squares/line of best fit' (www.youtube.com/watch methods to calculate the average slope and intercept for my ten seconds of data, then I plot the halfway point to get a suitable average output value, hoping it would smooth the data. However neither of these methods have solved the problem to smooth the graph enough to make it more legible. I would like my graph to look more like the "pace" graph in Garmin Connect, mostly flat and curvy in a few areas, but instead it shoots up and down and it's super hard to visually determine what the average and trends are.
I was thinking as a third option, perhaps plotting the median value of the array could smooth the data in the graph and make it more legible. Perhaps a fourth option might involve using simple exponential smoothing or some other variety, but the math confuses me and I'm not sure it's what I need. I also saw in the Math Module that there are already-provided functions for determining the mean, standard deviation, and variance of data in an array. Would these values be helpful for smoothing my data? There are also FIR and IIR Filters developer.garmin.com/.../Filter.html I know these are meant for smoothing data, but could I use them to smooth data before saving to the fit file, or are these functions more for smoothing sensor-accelerometer data as the page suggests?
Bottom line, can anyone explain how I might (ideally using already-provided functions) smooth my data before I save it to the fit file? Or if not, what technique for smoothing data do you suggest I use?
Thank you in advance
See below graph example: As you can see my data is hard to make sense of, it's all over the place. The two colors represent two earlier ways I unsuccessfully attempted to smooth the data. The native 'Pace' data in gray has been very well smoothed, and is very easy for the user to read and interpret; I wish I could make my data that smooth!