Grade Calc

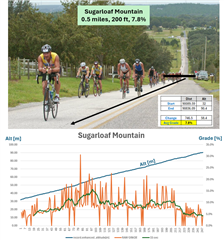
I don't know why I didn't do this before. Ugh. So I did a hill ride yesterday, recording data on my EDGE 1050. I used Garmin's FIT2CSV to pull the second by second data into EXCEL. I zeroed in on the 1/2 mile climb called Sugarloaf. The biggest mountain in Florida LOL. 200 ft of ascent on a continuous climb that averaged about 8%. Looking at my Garmin, the native GRADE hit 15% about half way up.

In Excel I can try many different approaches using the data CIQ sees, to estimate GRADE and balance noise -vs- delay. The ORANGE is the raw grade (change in rise -vs- run). Ouch! So bad. The GREEN is a 15-sec rolling average of RAW GRADE.  That looks like that climb feels. 10 sec avg felt too jittery. The climb slowly builds to about 15% then settles into about 8-9%, then eases up to about 5%.

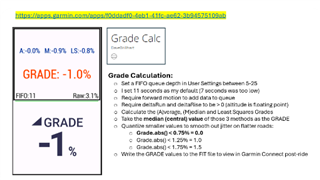
I'm going to implement that and test it on my Forerunner 955, EDGE 1030 and EDGE 1050. I understand Garmin made some significant "improvements" to the native GRADE algorithm in the EDGE 1050, so I'm not sure how this will look on the older devices. But using the FIT2CSV/Excel approach I will be able to quicky work out an optimal method. Rolling averages, Least Square, Kalman Filter, etc. I did get some rows where distance didn't change between readings even though speed never dropped below 4-5mph, and the barometric sensor doesn't always update every second. So some logic to throw out absurd readings before adding data to the queue is needed.

I'll update my findings once I get some decent samples on my 3 different devices.

  • After another couple rides, I've refined my approach. Seems complicated but since Garmin won't expose their native GRADE with have to play games with a noisy barometer sensor. I was watching the Average, Median and Least Squares grades over 7-seconds. That queue wasn't quite deep enough. But I did notice that under some situations, any of the three was best. And it appeared that generally any two of them were close and one was significantly wrong. So the new version of this field takes the central value of the three grade values. And I set the queue depth to 11 (that is a User Setting). I also write the GRADE to FIT so you can view the graph of GRADE overlaid on ELEVATION. If you'd like to try this field, here is the link: https://apps.garmin.com/apps/f0ddadf0-4eb1-41fc-ae62-3b94575109ab

    You'll see the Avg, Median and LS values, and the RAW GRADE. The larger Orange value is the consensus value. I like to set a screen to show the native grade and this field, to get a sense of how they track. Obviously there is a delay in generating a grade due to the queue depth. But after 10 secs or so of a sustained grade it should settle in.

  • I feel like this is a cool DF, but it's not for the average end-user IMHO. I would keep it as is, but rename it to debug or test and create one that only displays the consensus in a SimpleDataField. No confusing small numbers, just 1 big number and the % sign.

    Or if you like over complicated datafields (like I do) then keep it 1 DF, but make it possible from the settings to only display the consensus

  • Yeah this is just a temporary test field to refine my grade algorithm. I'll delete this field in a few weeks. But good ideal to rename it and describe it as a test field.

  • Another interesting finding. When you approach a stop and slow at a higher than normal rate of change, the GRADE calc gets thrown off. Even the native GRADE is impacted. On a flat road, as you slow quickly, the displayed grade can jump to -3-5% for a couple seconds. So I've implemented another check watching speed change and I don't populate my FIFOs if speed is changing more than 10% per second. That is an unusual and transient situation, but this avoids some outlier grades in the FIT file... I'll continue to refine this and I'll share my final code once I'm happy with it.

  • I follow your threads regarding “Grade Calc” because I am very interested in the calculation method. Unfortunately, I miss a description of what exactly you have changed in the store publication of any new version.
    I know roughly from your explanations here in this thread, but it would be nice if you could describe the various figures in more detail.
    Especially the two lines at the bottom I can only guess as “FIFO” and RAW Grade...
    BTW: “FIFO” is probably the sample rate over the calculation time - but what exactly does it mean for you? I only know it as “First In First Out”.

    And OT: what exactly is your datafield XDB with this lovely dog? Is it just for yourself testing? (Must admit, I have not downloded it)

  • I wrote a new field for XERT. They didn’t want people downloading it before we get done with some additional refinements :-) So the name and image were supposed to dissuade downloads. I’m headed out to a ride now. I’m really happy with Grade now. I’ll post details later today. I just added a feature that writes a count to FIT of how many times it selected Avg, Median or Least Squares. Talk soon.

  • Great efforts! But it needs a layout of nearly a simple datafield (only showing label and grades - and maybe a little grade icon) to use it on "normal" data screens!