download count and per device statistics mismatch?

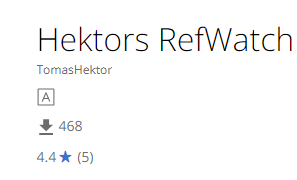
I have an app where the total number of downloads is 468, see screenshots from apps.garmin.com below.
But if I look into the "per device statistics" and scroll down to the bottom, I see this:
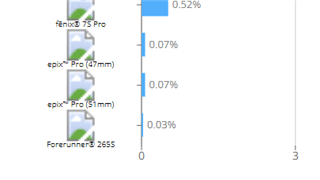
If I assume that there is only one (1) FR265S device that has downloaded my app, and that is 0.03% of all downloads, this assumption would imply that 100% would correspond to ~3300 downloads. Somehow the numbers don't add up or am I interpreting the numbers wrong?

Is perhaps the number of downloads equal to the current number of installed instances? And the per device info is statistics of how many that has ever downloaded it and possibly deleted the app afterwards?

  • TL;DR It's been established in the past that total downloads (468 in your case) is unique downloads (not including update installs). That number never goes down, so it can't be number of currently installed instances. (Besides, that information would likely be unavailable for older devices.)

    Based on what you said, I think the device stats must include updates.

    --

    Blogpost version:

    Well, one difference is that per-device downloads stats aren't tracked for older devices. I see that your app supports FR935 and Fenix 5 (non-Plus), but I bet you don't have download stats for either of those. (Based on which devices seem to be excluded from these stats I think CIQ 3.3 is the minimum requirement.)

    I realize that doesn't really explain this situation, bc it actually means that there would be even more than 3300 downloads, according to your reasoning, combined with the fact that the contribution of older devices isn't counted. (I verified that the percentages do sum to ~100%, for one of my apps which supports many older and newer devices, where a significant number of devices are missing from the stats.)

    To go back to what each of the numbers means:

    - The total downloads number (in your case, 468) should be unique downloads/installs. (IOW, if an app is updated, the count doesn't go up. Not sure what happens if an app is uninstalled and reinstalled.)

    - There used to be a daily/weekly/monthly downloads graph (not per-device or per-version) which counted non-unique installs (meaning it would spike whenever an update was released.)

    Is it possible that the per-device stats are also non-unique installs (including updates)? That might explain your situation, since you've had 14 versions. If all 468 of your unique users were there from the start and got every single update, you could expect to have 468 * 14 = 6552 non-unique downloads. Given that you seem to have about 3300 non-unique downloads (not even including a handful of old devices), that probably indicates your users are pretty loyal.

    Not that this helps, but if you look at the JSON response in the browser when the stats are retrieved, the device percentages are contained in an array called "totalDeviceInstallPercents". That doesn't really prove anything either way. The HTML element for the total download count has a class called "AppDetail_appDownloadCount__TCWmF", and that also doesn't prove anything. 

    It is worth noting that the stats for version downloads (which clearly includes updates) and the stats for devices are retrieved in the same JSON request, which suggests that the device stats are just like the version stats (they include updates.)

  • According to my mathematical understanding:

    x = number of downloads

    1 device = 0.03% of x
    1 device = 0.003 * x
    x = 1 / 0.003
    x = 333

    Cross-check:
    333 * 0.003 = 1   (nearly Nerd)

  • No, 0.03% = 0.0003, not 0.003. Note that 100% = 1.

  • All good, we all make mistakes Slight smile

  • ? Sorry, was just trying to be nice

  • No - that means „shame on me!“ 
    No reason for you to apologize!

  • When they added stats, it was clear from the announcement that it only contains data for system5 and above devices, that's why they always add up to 100%, and that's why it is possible that 100% is not 468 but significantly lower. This is also the reason these stats are almost of no value (unless you only support system5+ devices)

    That being said, I noticed that some of my apps have very different device percentage patterns. To my surprise my newer data fields have 20% fr55. My oldest DF has only 3%. Now I understand that there wasn't fr55 when I released my 1st DF, but still, this is surprising to me.

  • When they added stats, it was clear from the announcement that it only contains data for system5 and above devices, that's why they always add up to 100%, and that's why it is possible that 100% is not 468 but significantly lower.

    Yeah, I get it. Summing the percentages and verifying the answer is ~100% was only a sanity check.

    As OP pointed out, their app's device percentage stats suggest a minimum of ~3300 "device downloads" (give or take, considering the percentages are clearly rounded to 2 decimal places), which is incongruous with the total download number of 468.

    That's a difference of an entire order of magnitude, it can't really be explained by rounded percentages or anything like that. Given that we pretty much know the "total app download" number is "unique installs" (although it's unclear whether uninstalling and reinstalling an app will increment the number), we need to find an explanation why the "device downloads" number is 10X as high in this case.

    My point was that considering their app also supports devices lower than System 5 (CIQ 3.3), the true number of "device downloads" (whatever that stat represents) could be even higher than 3300 (unless nobody with an old device downloaded their app at all.)

    Finally, I guessed that "device downloads" actually includes updates, which would explain OP's numbers (they've had at least 14 distinct versions), and is supported by the fact that device download percentages and version downloads are returned in the same JSON response.