How to deal with low-memory devices

Hi,

On my quest to support more and more devices I have taken on the FR745 this evening. It seems that on the FR745 there is less memory available for glances than on other glance devices I tested so far (Epix Gen 2, Venu 3S, FR265). My app makes web requests to a third party server, and the response is relatively large, too large for the FR745 to process it in the glance. So I need to implement the glance differently and only show static information.

How could I implement such different behavior. Is there a way to check in the code how much memory is available? Or have code execute only for certain device types? Only way I could think of right now is to have a property in the device-specific resource folder, that tells me I should do something different. Is that the way, or is there something better?

Regards, Robert

  • I came across another thing I don't understand when trying to optimize my code.

    On the low-memory devices where I use a background task, the initialize() constructor and onStart(), getGlanceView() and onStop() are being called multiple times during startup. Is this normal? The instance (object number) seems to be the same all the time. Even the glance that is created with new() in every getGlanceView() then refers to the same object by some magic.

    This is my log from the Fenix 6 simulator:

    Background: 29.5.2024 6:41:51: EvccApp Obj: 144: initialize
    Background: 29.5.2024 6:41:51: EvccApp Obj: 144: onStart
    Background: 29.5.2024 6:41:51: EvccApp Obj: 144: getServiceDelegate
    Background: 29.5.2024 6:41:51: EvccApp Obj: 144: onStop
    29.5.2024 6:41:52: EvccApp Obj: 145: initialize
    29.5.2024 6:41:52: EvccApp Obj: 145: onStart
    29.5.2024 6:41:52: EvccApp Obj: 145: getGlanceView
    29.5.2024 6:41:52: TinyGlance Obj: 175: initialize
    29.5.2024 6:41:52: EvccApp Obj: 145: initialize
    29.5.2024 6:41:52: EvccApp Obj: 145: onStart
    29.5.2024 6:41:52: EvccApp Obj: 145: getGlanceView
    29.5.2024 6:41:52: TinyGlance Obj: 175: initialize
    29.5.2024 6:41:52: EvccApp Obj: 145: onStop
    29.5.2024 6:41:52: EvccApp Obj: 145: onStorageChanged
    29.5.2024 6:41:52: EvccApp Obj: 145: initialize
    29.5.2024 6:41:52: EvccApp Obj: 145: onStart
    29.5.2024 6:41:52: EvccApp Obj: 145: getGlanceView
    29.5.2024 6:41:52: TinyGlance Obj: 175: initialize
    29.5.2024 6:41:52: TinyGlance Obj: 175: onLayout
    29.5.2024 6:41:52: TinyGlance Obj: 175: onShow
    29.5.2024 6:41:52: TinyGlance Obj: 175: onUpdate
    29.5.2024 6:41:52: EvccApp Obj: 145: onStop
    29.5.2024 6:41:52: EvccApp Obj: 145: onStorageChanged

    Compared to that, on the Epix 2, with no getServiceDelegate() function and no onStorageChanged(), everything is executed only once:

    Background: 29.5.2024 6:45:33: EvccApp Obj: 144: initialize
    Background: 29.5.2024 6:45:33: EvccApp Obj: 144: onStart
    Background: 29.5.2024 6:45:33: EvccApp Obj: 144: onStop
    29.5.2024 6:45:34: EvccApp Obj: 145: initialize
    29.5.2024 6:45:34: EvccApp Obj: 145: onStart
    29.5.2024 6:45:34: EvccApp Obj: 145: getGlanceView
    29.5.2024 6:45:34: Glance: initialize
    29.5.2024 6:45:34: Glance: onLayout
    29.5.2024 6:45:34: Glance: onShow
    29.5.2024 6:45:34: Glance: onUpdate
    29.5.2024 6:45:34: Glance: onUpdate
    29.5.2024 6:45:34: Glance: onUpdate

    Since also in the first case AppBase and View all seem to refer to the same object, I don't think it will cause issues with the memory, but still I am wondering why this is happening.

  • Strange. However the "same" object is probably caused by this: your code is deterministic, so every time your app starts the same things happen in the same order. The "number" is not a memory reference, but an index of the object, so every time the object is at the same index, because all the other object were created in the same order. What's strange is that onStop isn't called before subsequent call of the inilialize.

    You can try something like this at the beginning of initialize:

    Math.srand(Time.now().value());
    var r = Math.rand() % 10;
    var a = new [r];
    for (var i = 0; i < r; ++i) {
        a[i] = new SomeObject();
    }


    And do all the other things after this. (also log r). I believe that now you'll see different numbers.

  • I think this is a bug in the fenix6/fenix6pro simulator. I use the same implementation for fr245/fenix6s/fenix6spro/fenix6xpro, and they work fine.

    I added your code but the weird thing is that even the "r" is the same for every instance of AppBase. Also after some unrelated code changes I now get with fenix6/fenix6pro:

    Kill app for run the app
    Failed to terminate app: Timeout

    But that is not the case all the time, at other times the multiple AppBase instances seem to not interfere with each other and at least one starts up fine in the end.

    I think I'll ignore that for now and test with the other fenix 6 variants.

  • I realize now that r is the same probably because all the calls to initialize are in the same second. What if you remove the srand call?

  • I'll give that a try and report back.

    But in the meantime I have two more questions.

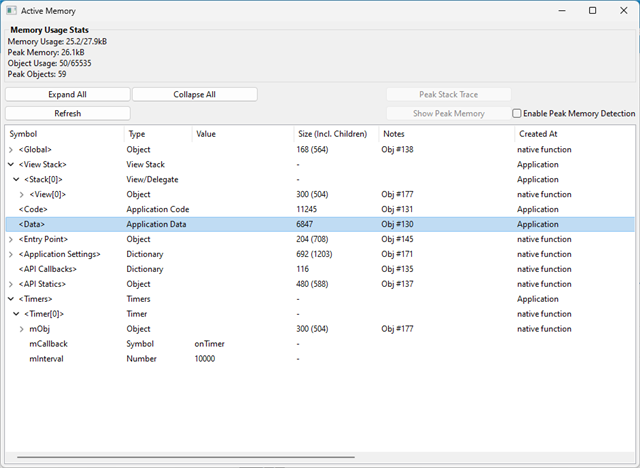
    When looking at the "Active Memory" view in the simulator:

    First, what is the <Data> entry there? I assumed persistent data is not kept in memory, is that correct?

    And I notice that "Memory Usage" is more than the sum of all symbols and their children in the list below. Is that normal?

    Like in the image below, the sum is 22,279, but it shows 25,2 kB memory usage.

  • Everything you see here is in the memory. Data is what's not code. If you have:

    const FOO = [...];

    then this will be in data.

    I don't see 22279 in the picture, so I don't understand what that is about.

  • I don't see 22279 in the picture, so I don't understand what that is about.

    Thanks for the explanation of the Data entry!

    22,279=21.6 kB is the sum of all the values shown in the list. But the memory usage is shown as 25.2 kB, and I am wondering what is taking those additional 3.6 kB. 

    I have now managed to get everything to work on the Fenix 6 in glance mode as well. The web service I am calling supports jq for preprocessing the JSON, and with jq I could remove all the stuff I don‘t need.

    Reducing the code also helped a lot. Removing all my debug outputs gained me a few hundred bytes. To remove files from my tiny glance implementation I duplicated them. I have a main source folder, and one each for the normal and tiny glance implementation. Those files that I need in the normal glance but not the tiny glance are in both folders, in the normal one they have the :glance annotation, in the tiny one they don‘t. That way they are still available for the widget of the devices running the tiny glance. It is not pretty because I have to apply code changes on both places, but it works.

    I have another question: there is a compiler option for optimizing code space. Does this bring any notable gain? I tried to add it to my jungle file, but did not see VS Code adding it to the compiler call, and also the memory usage seems to be the same as before. 

  • 1. regarding organizing the code: In order to prevent the hassle of having to do the same changes in more than one place you can (and should) do some other trick: If you prefer to work with small files in different directories, then you could have the common code in source, while the glance related code in source-glance-big, source-glance-small. It only needs a small change in the jungle and then some moving around of the code.

    Or if you prefer to have the same things in 1 file, close to each other, then you can just put everything under source and in the jungle instead of managing the sourcePaths you can add excludeAnnotations, something like: smallGlance and bigGlance, and in the code put (:smallGlance) or (:bigGlance) annotation on the class-variables / functions / classes. Just don't forget that it's a bit counter-intuitive. What I do is I use them more like "includeAnnotation" and because most of the time I deal with the mc code I like that to be logical, so in the jungle I have the "opposite" meaning, so for devices with low memory I would have something like:

    fr230.excludeAnnotations=$(fr230.excludeAnnotations);bigGlance

    and for devices with high memory:

    fr955.excludeAnnotations=$(fr955.excludeAnnotations);smallGlance

    This way in the code you can do:

    (:smallGlance)
    function foo() {do only the minimal things}

    (:bigGlance)
    function foo() {do all the things}


    2. Yes the compiler parameters do help a bit, but arguably there 2 things that help even more:

    - use the latest SDK (7.1.1)

    - use Prettier Monkey C extension in VSC

    3. I don't remove the debug output from the code, instead I have 2 versions of my log(str) function, annotated with (:debug)  and (:release) this is very handy, because all I need to do is to change the build type in the drop-down and can either "comfortably" code/debug (sometimes using a device with high enough memory so it works even with the logs) and then I can also test it in devices with low memory, by making a release build (and also run in the sim, or on the real device)

  • 1. regarding organizing the code: In order to prevent the hassle of having to do the same changes in more than one place you can (and should) do some other trick: If you prefer to work with small files in different directories, then you could have the common code in source, while the glance related code in source-glance-big, source-glance-small. It only needs a small change in the jungle and then some moving around of the code.

    Unfortunately the class I want to exclude from the small glance is necessary for the normal widget implementation on small glance devices AND for the big glance.

    So the .mc file containing the class is in the source-glance-big and source-glance-small, the only difference is in source-glance-big it has the (:glance) annotation, and in source-glance-small it doesn't.

    It seems exclude annotations cannot solve this, because they cannot be limited to glance mode, they'd exclude the file totally for the small glance devices, making it unavailable also when the app runs as widget.

    - use the latest SDK (7.1.1)

    - use Prettier Monkey C extension in VSC

    Thanks. I am on 7.1.1 already, but not yet using the Prettier Monkey C extension, I'll have a look at that!

    3. I don't remove the debug output from the code, instead I have 2 versions of my log(str) function, annotated with (:debug)  and (:release) this is very handy, because all I need to do is to change the build type in the drop-down and can either "comfortably" code/debug (sometimes using a device with high enough memory so it works even with the logs) and then I can also test it in devices with low memory, by making a release build (and also run in the sim, or on the real device)

    I started with such an implementation as well. But my version of log(str) is not that large, replacing it with an empty version with (:release) does not help that much. It was actually the calls to log(str) that took considerable code space. Cool would be of course to be able to annotate those lines of codes. I think you wrote that you had such an implementation for another dev environment, but not VSC, right?

    Talking about the drop-down, this is only if you build a binary for side-loading, right?

    How is it with debug vs release, does the debug build generally take up more space in memory for the not annotated code?

    And how is it when I test memory limits in the simulator, is that always a debug build, or a release build if I run it as "Run without debugging"?

  • One thing to consider is instead of trying to squeeze things in with jungles is to re-write parts of your code to improve memory usage for the main app, the background, and glance.  It's a bit drastic, but I've done it for some of my early apps when I was just learning Monkey C, and in the long term has made those apps easier to maintain and add new target devices.

    A bit of history.  For CIQ1 devices, data fields were limited to 16k and one common thing to get a smaller app was to skip using layouts and just use dc calls.  You won't save a ton of memory but every little bit helps.