App crashes in simulator w/o any further information

Hi all,

I'm terribly stucked with an app that was working fine for 2 years. All of a sudden I'm unable to launch it in any simulator, on 2 different pcs (one running the project from within Eclipse, the other from Visual Studio Code).

If I open a memory output in the simulator it closes automatically without anny output.

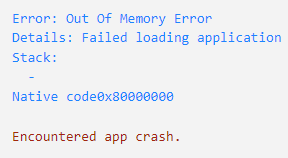
The only information on the debug console is

Error : Out Of Memory Error

Details: Failed Loading Application

Stack:

Native code0x80000000

There are no BUILD warnings/errors.

It's happening on every device, even those I was able to work with some weeks ago. It's happening with SDK 6.4.2, 7.0.2b, 4.1.7 and others. I don't even know where to start ince there seems to be absolutely no helpful information. Maybe it's a trivial issue, but actually I feel dead in the water...

  • Comment out some part of the code, then start to debug and add back gradually.

    Usually later versions of the SDK have better compilers, and the output is smaller, so it's a bit strange, I wouldn't expect it to grow that much. (I did see between certain version upgrades that the code size grew, but only by a few bytes < 100)

    If you did changes in the past 2 weeks, then try to look there, maybe it's some memory leak very early on.

  • I haven't changed the Code since the last working version, so how could I work backwards? It all starte when I enabled another device family in the products. When I switched back to some other configuration it worked. After coming back to the project after some weeks it didn't, and also failed on new installations. 

  • OK, then what did change? I see you tried it with multiple SDK versions. If the code and the SDK haven't change then what did?

  • Nothing did. In fact I restored exactly the sources of the last running project (which still was in Eclipse) on a brand new VS Code installation.

    Some few devices (i.e. Fenix 5 plus" still work, most others don't (app crash). The generated PRGs vary around 64k size (I still managed to find some older PRGs which were running fine - and those had about 116kB).

    If I look at the memory usage in the simulator for one of the working devices Fenix 5 plus), it tells me that there is in fact very little memory usage. Unfortunately on the devices where the load fails like this 

    there is no memory window from the simulator...

    I have also tried to comment everything out so that there only remains an empty app frame (but I don't believe in a code issue since there are still some devices working). However the behaviuor stays the same.

  • So commenting out most of the code didn't help? What about some of the SDK samples? Do they work?

  • Yes, at least partly. When I started to copy resources from the failing project into a new project (where I planned to test samples code), it suddenly read "undefined symbol qout", which is a trivial standard. Couldn#t find any help on that online, but in the process I stumbled over the actual issue:

    For some reason, my application type has changed from "Watch app" to "Widget" in the manifest! Clearly there are other memory requirements here. When I corrected it back to "Watch app", the project ran fine on both the Eclipse and the VS Code environment!