I don‘t get the CIQ app statistics

As per title - I don‘t understand the graphs of the CIQ statistics.

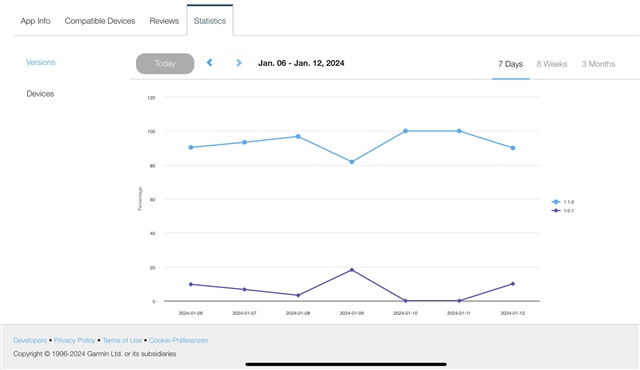
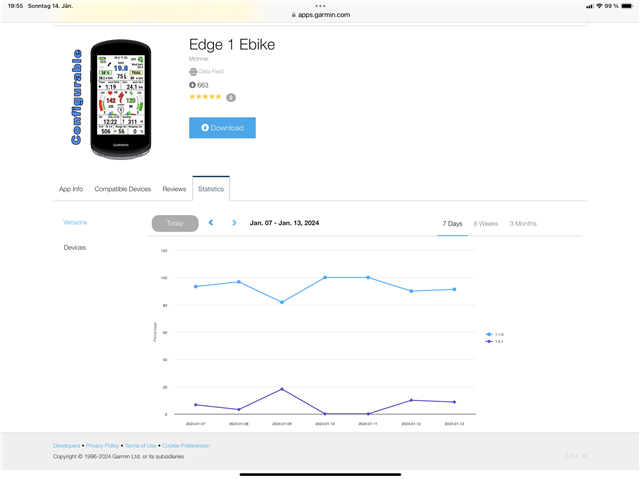
As an simple example: here are the 7 days figures for one of my datafields.
The dark blue line (bottom) is version 1.0.1 which is not available anymore since end of November 2023. Since December only version 1.1.0 (top line) is available for downloading.
How is it possible that this old version has a risen line of downloads in the last days?

  • The way I've always seen this, is while you put a new version in the store, the purple line here is showing you how many users still have the older version of the app.

  • Yes, but I've never seen older versions grow. How could that be?
    a) maybe 1.0.1 supports devices that are no longer supported in 1.1.0 ?
    b) maybe some people side loaded it, but I doubt that 10 people did that as well as if side loaded apps can even show up in this statistics 

  • I don't think you are seeing new installs, but what you see here is the number of users that are using the older version.  Some days it could be 1, some days 10.  I see 5 different "version lines" for some of my apps and they older ones do bounce around a tiny bit

  • IMHO these are not "numbers" but rather percentages. If the app is very new then maybe 1 download/install/usage can mean 10% though...

    But yeah, if you're right about "usage" vs "installs" or "downloads" then it makes sense that an older version can increase.

  • The percentages actually do translate to numbers - the percent of unique installs.  Here's one of my apps, where you actually see 5 different versions, and none of them are straight and level lines.

    In this case, I get about 200 new installs every day

  • Here is the full picture of the datafield:

  • with 663 unique downloads, what you see on the purple line is much more evident as 60 users not installing the latest update is about 10%.  With 6000 unique downloads, that 60 users would be more like 1%.

    There is no way to force a user to install the latest version of something, so you'll always see people running an older version.  Some people are "if it's not broke, don't fix it", some don't run the mobile app that often to get updates, etc.

  • Jim you're contradicting yourself! If the percentages translate to unique instals then how can the number of uniq installs of the version that is currently not downloadable grow?

  • The unique downloads for an old version doesn't grow, but the purple line changes based on how many users are still using the older version that day..  The more downloads of the newest version, the smaller the peaks and valleys and over all height of the "purple line"

    With 663 downloads, split between the 2 version, the purple line is obvious.  If 663 new users download the new version, for a total of 1326 downloads, the purple line is less obvious.

  • I know that there are more important things than the direction of the statistics lines Grinning
    But nevertheless - for all those who are still interested:
    The basics:
    -Firstly, the first version is the only one available. From the first download, the statistics line must be at 100% - regardless of how many downloads there are. The line must always remain at 100% - there is only this version.
    -When a second version is made available for download, the number of downloads of the first version is frozen and can no longer change. Any further increase in the total number of downloads must now be counted towards version 2. This change can only increase (or remain the same if there are no downloads). However, the change in the number of downloads for the new version cannot decrease under any circumstances (regardless of the number of downloads).

    It is therefore incomprehensible to me why the line of the new version can fall (and thus the line of the old version rises in order to reach a total of 100%).