
Here is an example of the resources I load (Ignore that the arrays are the same, it is just an example)
<jsonData id="data1">[[14.552,46.017,14.558,46.108,14.44,46.088,14.463,46.035],[14.552,46.017,14.558,46.108,14.44,46.088,14.463,46.035]]</jsonData>
<jsonData id="data2">[[14.552,46.017,14.558,46.108,14.44,46.088,14.463,46.035],[14.552,46.017,14.558,46.108,14.44,46.088,14.463,46.035]]</jsonData>
<jsonData id="data3">[[14.552,46.017,14.558,46.108,14.44,46.088,14.463,46.035],[14.552,46.017,14.558,46.108,14.44,46.088,14.463,46.035]]</jsonData>
I use menu 2 to fetch the ids as an array
function onSelect{
if (such n such){
Map = [:data1,:data2,:data3];
}
Load and draw a different part each update:
function loadMapResource() {
System.println("load1");
if (Map != null){
System.println("load2 ");
MapArr = WatchUi.loadResource(Rez.JsonData[Map[NumPick]]);
WatchUi.requestUpdate();
}
}
function onUpdate(dc) {
var py = null;
var px = null;
var pyOld = null;
var pxOld = null;
var heading2 = Sensor.getInfo().heading;
if (m != null){
if (MapArr != null) {
m = m.toDegrees();
dc.clearClip();
for (var i=0; i<MapArr.size();i++){
var arr = MapArr[i];
for (var j=0; j<arr.size() - 2;j+=2){
var long = arr[j];
var lat = arr[j+1];
var pixelsLon = (long - m[1]) * zoom + (gw/2);
var pixelsLat = (m[0] - lat) * zoom + (gh/2);
py = pixelsLat.toNumber();
px = pixelsLon.toNumber();
var pyRot = Math.sin(heading2) * (px - 120) - Math.cos(heading2) * (py - 120) + 120;
var pxRot = Math.cos(heading2) * (px - 120) - Math.sin(heading2) * (py - 120) + 120;
if (pxOld != null){
dc.setPenWidth(3);
if (j==0){
dc.setColor(Graphics.COLOR_TRANSPARENT,Graphics.COLOR_TRANSPARENT);}
else if (j > 0) {
dc.setColor(Graphics.COLOR_GREEN, Graphics.COLOR_TRANSPARENT);}
dc.drawLine(pxOld, pyOld, px,py);
}
pxOld = px;
pyOld = py;
}
if (i == MapArr.size() - 1){
if (NumPick != Map.size() - 1){
NumPick = NumPick + 1;}
else if (NumPick == Map.size() - 1 && i == MapArr.size() - 1){
NumPick = 0;
dc.clearClip();
dc.setColor(Graphics.COLOR_BLACK, Graphics.COLOR_BLACK);
dc.clear();
dc.setColor(Graphics.COLOR_TRANSPARENT, Graphics.COLOR_BLACK);
}
dc.setClip(0, 0, gw, 40);
MapviewerView.loadMapResource();
}
}
}
}
}
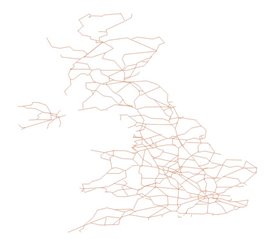
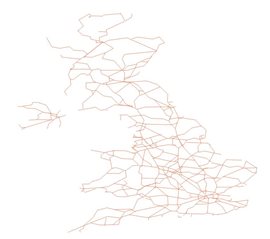
As you can see the orangey brown line image is the desired look,
the gif is what I get:
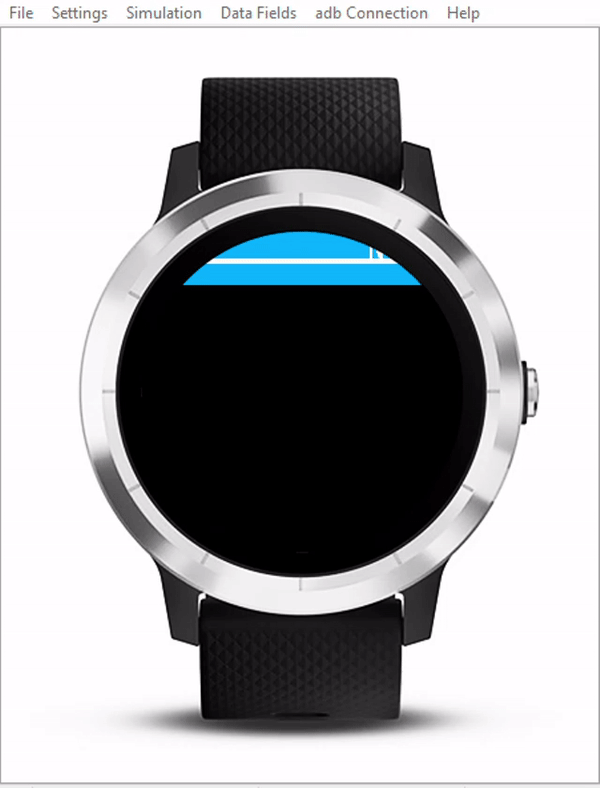

 Also this image gets cut off on mobile so i'll place it here