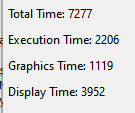
is it sum of last 10 seconds in micro seconds?
profiler for 10s shows:

and 30ms is calculating form total?
So in example above average is 7,3 < 30ms, right?

is it sum of last 10 seconds in micro seconds?
profiler for 10s shows:

and 30ms is calculating form total?
So in example above average is 7,3 < 30ms, right?
Watchface Diagnostics updates every second, The 7.3 is the current second, not the avg. You want to watch it for a full minute to see how you are doing against the 30ms AVG. Try it with something like the Analog sample. You'll see it's lower when the second hand is at 3 or 9 and higher at 12 or 6. The number of rows being updated impacts the top number.
I wouldn't use the profiler and compare it with the diagnostics, as they are likely measuring different things.
Beautiful tool :( It has all needed numbers but no units and any conclusion...
So, to check power budget you need calculate average by SUM(TotalTime during 59 second)/59/1000 < 30
I don't calculate it. I just eyeball it over a few minutes between 00 and 59 seconds. And if there is an issue, onPartialUpdate will stop and in the delegate, you can see how far you are over,
7277 -> 7.3 it can be in one second rather sum as it total time.
Profiler shows 6000 per 10s (10 x onPartial) and 600 ave per one so 6000 corresponds to 7.3 especially then diagnostic start I can see about 1000.
let's ask author Travis.ConnectIQ :-)
I had nothing to do with the watchface diagnostics tool.
TL;DR - you can't compare the times shown in the profiler against the times shown by the watch face diagnostics.
Based on the code, it is *not* displaying an actual clock time. It is showing you an estimated clock time based on performance values that were generated when the device first added support for ConnectIQ. The performance timing system doesn't have enough precision to tell you how long it took to draw a rectangle, or execute a single virtual machine instruction. So we run a diagnostic test that determines approximately how many operations of various given types can be performed in a millisecond. Then we use this and the number of operations to get an estimate of the elapsed time.
This is most likely why we are not displaying a time unit here at all... because it is not real time.
The profiler is different. We actually grab a time stamp at the entry to a function, and at the exit from the function, then the profiler dialog does all of the heavy lifting to calculate the actual time spent.
Tool is for something.
The only thing I know is power budget < 30 ms. So what does exactly mean? How to estimate power budget? In other words, power budget is the number so I need number to compare. Now I can see 4 numbers, let's take the biggest one 7277 - what does it mean according to 30?
The number you want to watch is the top one.
When it's 30000, that's 30ms. 7277 is 7.277ms