


I'm making good progress on my first watchface and wanted to start to reorganize the code to maximize battery life. I wanted to get a starting baseline so I could see what actually helps, so I started up the simulator and opened up Watchface Diagnostics, and I'm confused at the values I'm seeing. Given some diagnostics examples shared by other users, I was expecting to find values in the hundreds or thousands. I find it hard to believe that my un-optimized watchface is so incredibly efficient that it takes ZERO time to display...
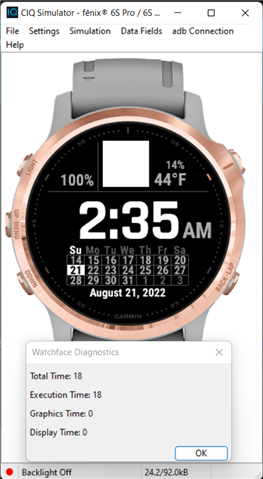
I have low power mode enabled in the simulator, but I see the same thing in the Diagnostics view whether it's enabled or not. Is there something that might be throwing the display off?
I'm using the latest SDK and simulator (4.1.5) and using Eclipse Photon with the Connect IQ extension for development.
