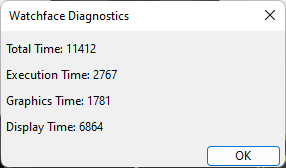
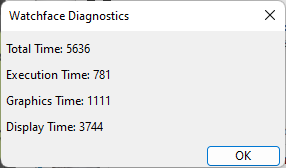
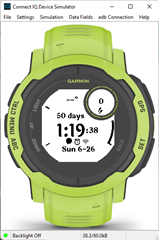
I have an onPartialUpdate implementation that I've benchmarked in the profiler to be quite fast (less than 1ms on average).
I'm also manually tracking max/average (via System.getTimer()) and getting average speeds of 0 or 1ms, and max of 4ms (in agreement with the profiler).
If I run the code long enough, suddenly my power delegate is tripped up with a
executionTimeAverage 915.913635
That disagrees with the average that I'm tracking, which is so low it's 0-1ms.
For a measurement to affect the average so drastically, (e.g. after seeing 200 samples of sub 1ms times), I'd need a sampled value of over 3 minutes. That did not happen. I was watching and 3 minutes did not pass by.
Note that this trips up hardware too. So, hardware and sim claim that onPartialUpdate averages 900+ms, while manual benchmarking and profiling suggest 1ms.
So what might be going on? And how might I track down the cause?