request for sample code draw a graph/chart

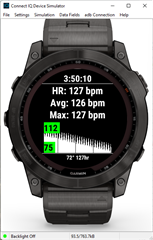
Hi, does anyone have some sample code for drawing a chart or graph from an array/storage (time vs height)?

Thanks

  • Hey man,

    Came here with same question, but discovered yours. If Garmin published their own stock watchfaces as open source with comments this would make learning much, much faster (or if they provided a fat repo with loads of sample code...). I managed to find two open source watchfaces with graphs:

    1. This implementation is nice and supports diverse data sources and is pretty easy to tweak for your needs: https://github.com/RyanDam/Infocal/blob/master/source/complication/GraphComplication.mc

    2. This implementation is a bit rough, guy did not move the logic to separate drawable subclass, but it works: https://github.com/darrencroton/SnapshotWatch/blob/master/source/SnapshotWatchView.mc#L223

  • Native watch faces aren't written in Monkey C, so open sourcing them won't happen.

    Drawing a basic graph is pretty simple.  You define the area of the graph, define what the y axis is, and scale x based on the min and max.  The real question is how you want the graph to look.  Here are a couple of mine:

  • Nice graphs :) yeah, basic idea of a chart is simple, but having a nice, customizable open-sourced class (along the lines of GraphComplication above, but with styling moved to separate methods) would flatten learning curve. One would reuse the code and tweak fragments responsible for styling the graph (or inherit the class and redefine proper methods, etc). 

    Wow didn't know native watchfaces are written in different language. I assume it's C? Makes sense for Instinct since native watchfaces allow in-watch customization.

  • In both cases, these graphs are just a function, not even a class. I use the same function for temperature, pressue and elevation as I do for heart rate Having a generalized and customizable graph in CIQ would use much more memory in an app than is needed.

    CIQ also allows on device customization for watch faces.  Here's one of mine that runs on the Instinct 2 as well as a number of other watches:
    https://apps.garmin.com/en-US/apps/c051f37a-8fad-4907-b124-0112fe010c91

  • Native watch faces aren't written in Monkey C, so open sourcing them won't happen.

    But garmin could wrap them in an object that can be called by Monkey C.  Offloading from an interpreted language would mean the logic to draw could be more efficient.  Plus could allow for optimizations as the complexity of doing so can be ignored by the developer.  For example say you want a graph during an activity where you add a new data point every x time interval. 

    The easy way to do this is draw the whole graph each time new data gets added like GraphComplication sample code.  But why are you drawing 90 lines each time you paint the graph?  That's very inefficient.  Better to cache a BufferedBitmap (ie shift the BufferedBitmap to the left by one dropping the pixels that are cut off and add the new data to the right and copy that buffer to the screen) which should result in much less calculations.  But your graph looks fine without doing the extra optimizations and everything works?  Maybe true but those extra calculations use power so impact battery life.  (i.e. make it easy to get people to write good code)

  • Uh, no.....  How many apps have you written and published?

  • Redrawing the whole chart each time there is new data to add is not less efficient?

    Having a reusable object that all connect iq developers could use is not helpful?  Having it done in native code wouldn't make it much smaller in memory needs? Or do you just like the idea that everyone should reinvent the wheel for every app? 

  • Especially in a watch faces, you must redraw the entire graph with each call to onUpdate().

    As far as size, a generalized graph funtion/class/barrel to do a whole bunch of this will take more memory than a 10 line bit of code to draw a specific graph.  You're dealing with devices, which in general, have a very limited amount of memory.  Are you talking about have a graphing view in the native FW that's used by CIQ?

    I have a barrel for things in SensorHistory to extract data, graph data, etc, but even that's that anywhere close to being able to graph any data.  It's got to be from getABCHisory of some sort.

  • Especially in a watch faces, you must redraw the entire graph with each call to onUpdate().

    Repaint the whole graph, sure.  Redraw the whole graph? no.  Whats the difference?

    Redraw (i.e. what GraphComplication does) - 
    Each and every onUpdate has a loop of 90 iterations.  In each iteration it pulls out a value from a data structure and does a good number of calculations on that value and does a call to draw a line. 

    What happens the next time a redraw happens?  89 of those calculations are basically the same work that was already done.

    repaint (i.e. double buffering) -
    Each onUpdate what happens?  Draw cached bitmap to the left by one pixel (or width of a bar if a bar graph), Take the new data point, do the calculations, draw a single line on the right.

    Next onUpdate, same thing.  Notice instead of a loop of 90 calculations, its only doing one.  The work of drawing what was already done is in the cache so reuse it.  Sure a full screen graph on a 1030/1040 is 16k for the cache but you're probably not doing full screen

    Are you talking about have a graphing view in the native FW that's used by CIQ?

    Would be better if it was some native object so could take up less memory that could be treated like a bitmap in that you could then draw it where you want it to go.

    The ideal (but don't think possible on the current hardware) is it should be possible to have all data fields on a garmin done as Connect IQ data fields.  All the data needed, but also the graphics ability.  I don't think reimplementing the wheel by each developer is a good way to go and I think there should be more graphical fields.  I think the hard part should not be drawing the graphics efficiently, but how to use the graphics

  • When you move the buffered bitmap - how to you truncate the "left/oldest data" side to prevent redrawing graph border?