Strange. I am using the latest SDK (4.1.0 Beta 1) that shows up in my SDK Manager. I can run my data field. I can start the Profiler. But as soon as I hit STOP in the profiler, it aborts with this message. Any clue what I'm doing wrong? Thx!
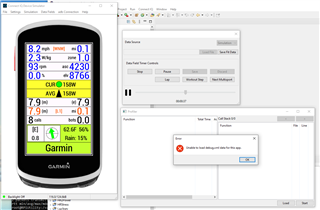
Strange. I am using the latest SDK (4.1.0 Beta 1) that shows up in my SDK Manager. I can run my data field. I can start the Profiler. But as soon as I hit STOP in the profiler, it aborts with this message. Any clue what I'm doing wrong? Thx!

If I run the profiler with my DF it stores a file named MyDatafield.prg.debug.xml in the bin folder of the project. Is such a file in the bin folder also available for your project? May be the path should be adjusted.
When you run an app in the simulator it sends the .prg and .debug.xml files over to the simulated device. The .prg gets copied to GARMIN/APPS and the .debug.xml goes to GARMIN/DEBUG.
One of our developers ran into this problem the other day. I believe this should work with the 4.1.0beta1 SDK. It may also require the most recent version of the vscode extension as well.