Performance Profiling my Data Field

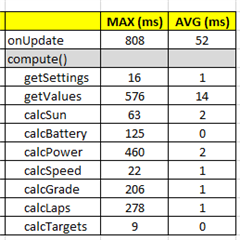
I added getTimer() calls before/after the logic functions in compute(). And calculated the max and avg duration of each call. About 5000 iterations. I avoided startup skew by waiting 10 secs before starting to collect the data.

Is it reasonable that the average duration of relatively complex compute logic functions take only 0-2 ms to run? Or is getTimer() not reliable on an Edge 1030 device? I know it isn't reliable in the simulator.

And it is interesting to me that the MAX durations are so much longer than the average. Not sure why such a huge variance between the average duration and max - what could cause, say, my calcSun (determines sunset and sunrise) to avg 2ms but at least once, took 125ms to complete?

I was also using a 126 mile turn-by-turn route during my ride, so possibly when I deviated from the route and it recalculated the route to offer a way to get back on route, that slowed the processing of the functions?

Top Replies

  • And it is interesting to me that the MAX durations are so much longer than the average. Not sure why such a huge variance between the average duration and max - what could cause, say…

All Replies

  • And it is interesting to me that the MAX durations are so much longer than the average. Not sure why such a huge variance between the average duration and max - what could cause, say, my calcSun (determines sunset and sunrise) to avg 2ms but at least once, took 125ms to complete?

    Usually, reliable performance profiling is only possible if the ciq app runs independently on its own thread.

    I'm not sure, but current devices only use a single processor with one core. This means that all processes, both native and ciq, have to share a single core and must be scheduled, i.e. they must be swapped in and out for execution. Scheduling can be done in fixed time increments or based on system resource requirements.

    For example, when the native SW reads from or writes to the mass storage (e.g. writing the timer time), the execution of the ciq application is interrupted. However, the timer time (i.e. wall clock time) continues to run without interruption. Therefore, the timer time increments that are calculated also contain the waiting times of the process and a simple analysis of the timer times gives strange results.

  • That makes sense and explains the MAX durations being extraordinarily long. So I guess a function taking on the order of 1ms is legit?

  • I recommend to try the new profiler that is part of SDK 4.1.0 Beta 1, where profiling is done at the sim not at the device.

  • I noticed the profiler has two different measures, "Actual Time" and "Total Time". By any chance, can you explain the difference between these two?

  • According to VSCode description:

    "Total CPU indicates how much work was done by the function and any functions called by it. High total CPU values point to the functions that are most expensive overall."

    "Self CPU indicates how much work was done by the code in the function body, excluding the work done by functions that were called by it. High Self CPU values may indicate a performance bottleneck within the function itself."

    docs.microsoft.com/.../beginners-guide-to-performance-profiling

    docs.microsoft.com/.../cpu-usage

    So I assume that VSCode Self CPU is equal to CIQ Actual Time.

  • And may be you want to have a look at this GDVC 2021 breakout at 4:30

    www.youtube.com/watch