


I've only just started playing with the SDK and debugging through eclipse was working fine for my basic watchface. However if I load the WebRequestApp from the samples, placing a breakpoint doesn't get hit unless it's in the initialize() function, which runs right when the app launches in the simulator.
I see that when you actually select the widget to open it (using the watch buttons in the simulator), the thread in the debug window displays "<terminated> IQ Thread". Is this what happens? Opening the widget destroys the original thread, therefore detaching the debugger and stopping the debug operation?
Is there any way to get around this or re-attach the debugger? The simulator is still running the application...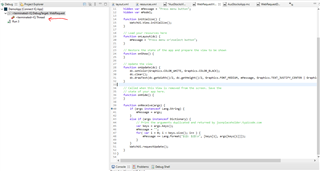
Cheers!

