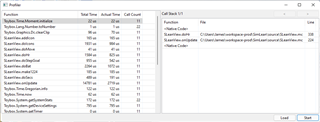
I wouldn't expect the simulator to give real times for the simulated device. What matters to me are 2 things which IMHO the simulator does correctly:
1. Give me an idea which is the slowest part of…
Right like I said it's "common forum knowledge", I think he just wants an "official source". I understand the implicit concern that on the forums, we're all just playing a game of telephone and/or repeating…
And someone called Average developer Joe wrote about it in the forum ;)
Two different optimizations are discussed here - size and speed. When it comes to size, shortening variable names may help, but were taking about a small amount - which can matter on older devices with a 16k limit for data field. There are other things like using direct dc calls vs layouts that will also help with memory. I tend to always user short names for things, but for readability (and long time support) use names that are easy to ID. (I've got apps that I wrote 6 years ago, and might not have looked at the code in a couple years, so readability matters)
As far as speed. Hermo posted a code example, where you don't repeatedly do things you only need to do once
var center=width/2 instead of using width/2 all over your code. Every little bit helps.
For me, I also use "has" only one time in an app (initialize) and set a boolean instead of doing it all the time in onUpdate(). When you do a "has" it looks though a dictionary which is more expensive than just checking a Boolean. When it comes to settings, I load the settings in initialize and again in onSettingsChanged(), and not each time onUpdate() is called.
Sometimes there's a trade off between size and speed, and the way you do something can vary based on which optimization you are looking to do.
Hi, there are many optimization topics and don't know in which to write.
Do you know how costly the api calls are? Especially interested in sensor history calls, would requesting only last value make a difference comparing to leave the default behaviour returning all?
What about the System.getSystemStats() and Activity.getActivityInfo()? This last one i really don't understand when is null and when not, i mean, my watchface is not running when an activity is running, so it should be null always but after i return to the watchface i do get a value (i need it for gps location)
I did some optimizations on onUpdate because it is sometimes running at 1 sec for 15sec and is not necessary, i count how many times it ran and i interrupt it if too often. I noticed however a strange behaviour when returning from another place to a watchface, if i leave it to run only one iteration my watchface looks freezed in the middle of the animation, it is faded out. Seems that i need to leave more iterations to run even if i need it only once. I left it to 5 for but when turning the wrist will really don't need 5.
I think you should let the watch know when an update is needed and not try to guess. if onUpdate was called you should draw to dc. However you might cache the calculated values and not calculate them all the time, just use them to draw as fast as you can.
Have you looked at the profiler in the 4.1.0-beta1 SDK? With it you can see things that id bottle necks -

In my opinion
1. length of variable has no influence of anything - it change to symbol. But maybe a lot of different names have. I'm not sure to the end how CIQ app run but if it search (in runtime) in symbolTable each new name costs. So I use in many place var temp; and have only one symbol.
2. Good idea with "has". I'm not sure if it helps but change my code.
3. Using buffered bitmap. I remove it because test in profiler shows they are slower than direct drawing (I hope profiler counts good). And after reflection it's normal. Original dc form onUpdate(dc) has to be "system buffered bitmap" because I can't see incremental drawing on screen so it means that real drawing takes after exit from onUpdate.
I improved my onUpdate execution time from 5500 to 4000us of the first iteration (this times probably are different on different computers? however i'm not concerned since i lost only 50% in one week and the Garmin estimation was 9d in total)
1. Cache calculations that won't change (in my case the lines coordinates and numbers positions of an analog watch, sunrise...)
2. array.size() in loops will be called on each iteration
3. setColor only if it changes
4. read the properties only once when starting the app or settings change
5. toString seems to also waste time but drawText method takes numbers even if the docs don't mentions it
6. drawing native fonts or custom fonts doesn't make a difference, if something, i thing native is more expensive.
After the first iteration the time should be shorter with at least 2000us
I'm also executing only 5 iterations in a row instead 15 that i get at each start or wrist watch.
Thanks for the info. I noticed in the profiler there is "Actual Time" and "Total Time"... what is the difference? And which value are you reporting?
I improved Total time, i understood quite late what Actual time means since i didn't found any explanation. I think Actual time is the time spent in a method subtracting the time of other methods inside. Not sure though if API calls are subtracted or not.