Memory Usage and Properties

Would someone be able explain in detail what is sequence of events. what's happening in memory and what is the difference between moment application is "build" in simulator (aka started on watch ?) and "All app data reset" in simulator, please?

Background story:
I've created watch face where every field/object is user configurable with parameters such as font, position on the screen, colors and few others separate for labels and values. This requires a lot of user settings/properties (297 at the moment), corresponding strings etc. That all consumes a lot of resources as expected. However there still should be enough reserve based on my calculation.

Unfortunately that's not the case during app startup/build. Being close to the limit it prevents me to implement new features. See attached picture

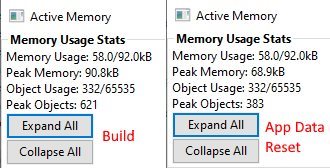
I assume settings count is the only contributing factor as changing only their amount makes big difference during my app start tests.
While I have space to kind of "optimize" the settings, that would make it extremely user unfriendly.


Hence i am trying to find the way how to get around that as i am struggling to understand what would be 20kB memory handling difference during settings reset and why would Garmin not use the same mechanism during app start.

EDIT1: to add, i am not running over 69kB any where during the runtime.

  • Ok, 297 settings is really on the extreme side - people have run into issues with not more than a 100 or so.

    What happens when settings are used, in the sim, there's a json file in the project's bin directory that defines the settings.  On a real device, that info is obtained from the app store (it's included in the .iq file when that's built).  That's why you can't do settings with a side load.  The need info isn't in the app store..

    So let's say you then save new settings.  That info is then sent to the watch.  But the app already has the previous settings in memory, so there's a time while the new settings are merged, the settings can take twice the memory.  That doesn't happen when a watch is first loaded, as no merging is needed.

    That's why you see the peak increase when you change settings..

    In the sim, when you do a "app data reset" (which you don't really do on a real device), it zaps the  apps's .set file (in the sim's temp directory) and loads the defaults for the properties.

  • Thanks Jim, agree it s a little on extreme side, but hey user can do whatever their immagination allows and that was the intention.

    Was there any discussion with Garmin regarding changing the way how settings are applied  ?

    Based on my calculation i would expect trippled memory usage during onChange in case Mechanism (old) -> (fullmergefirst) -> (new New) is used, and i would still argue there are better ways of doing such thing especially on devices with small memory and strong memory limits.

    But why is same behavior seen during app start when app is supposed to have no settings in memory because it is loading them right at that moment ?

    In addition during my  testing i cached all current settings into the memory variables and kept them referred, never got over 80kB and I could do whatever modification i wanted to them during the runtime while whole app was running.

    Therefore having 20+% of available memory used during app start when i would expect logic like:
    1.) Get the settings first
    2.) Compile them to whatever form is needed
    3.) Now start the app using these settings

    seems  like something is wrong here. Or i am missing something big time.

    Assuming the latter as i cant imagine developers would just accept that without having very good reason. Hence would like to understand detailed mechanism and why it has been chosen  ... or start bother people to do it better next time.

  • I think memory and settings came up the first week after settings were introduced back in 2015-2016 Slight smile

    Once again, when an app starts, the settings are loaded, but then when settings are changed, it's got to merge those with what the app currently has loaded..

    Even if you don't have "onSettingsChanged(), that doesn't matter, as the memory hit has already occurred.

    Having 297 properties is why you see a big hit.  I've never heard of anything with more than say 110..

    In my 50 apps, I counted a while back, and the max I use is under 50.

  • I know why i am getting hit. The point is, i should not get that hit during app start. I should get it on settings change if initiated.

    As a matter of fact in best case i should not get that hit even during onsettingschange if optimized settings change method would be used assuming my settings with their IDs can still fit to the memory together with code and runtime variables.

    Ok, becoming pain in the ass it is :). Thanks Jim.

  • When an app starts, all your properties are loaded into memory.

    Then after that, it will increase when you load custom fonts, strings, etc.

    Also, there's a general startup hit to memory, so you'll see a peak after starting