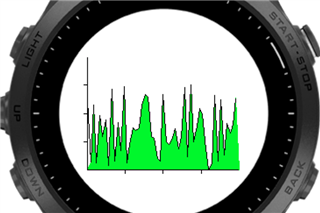
Fill Polygon is not filling the whole polygon

I have created a line chart:
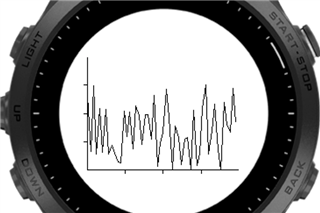
Now I want to fill the space between the x axis and the line by creating a polygon and filling it. But the code (see below) results in some weird filling behavior:
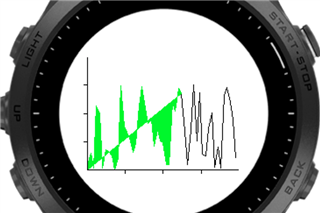
The chart line looks different because I'm using random values for creating the chart. Here is the code:

  function draw(dc) {
    dc.setColor(Graphics.COLOR_BLACK, Graphics.COLOR_BLACK);
    var fillPolygonCoordinates = [];
    fillPolygonCoordinates.add([minX, minY]);
    
     // construct and draw lines
    for(var i=1; i < 50; ++i) {
      var x1 = minX + xAxis.getLengthInPixels() * ((i - 1) / 50.0d);                  
      var x2 = minX + xAxis.getLengthInPixels() * (i / 50.0d);
            
      var y1 = yRelativePixels[i-1];
      var y2 = yRelativePixels[i];
                             
      var point1 = new Geo.Point(x1, y1);
      var point2 = new Geo.Point(x2, y2);
      var line = new Geo.Line(point1, point2);    
      line.draw(dc);      
      fillPolygonCoordinates.addAll([[x1, y1], [x2, y2]]);
    }
    
    fillPolygonCoordinates.addAll([[maxX, minY], [minX, minY]]);
    dc.setColor(Graphics.COLOR_GREEN, Graphics.COLOR_GREEN);
    dc.fillPolygon(fillPolygonCoordinates); // This is commented out for the first screenshot
  }

What am I doing wrong here?

  • I think you overcomplicate it by drawing the line and adding the line coordinates to the array.

    Just collect the points and do a single fillpolygon call at the end. The contour of the chart will be visible.

    I use this approach for my widget TidalFlow.

    Just note that fillPolygon can take a max of 60 points I think, so if you have more, you’ll need to do it in batches. Be sure to start the next batch at same point where you finished the last point. When ending a batch, last point should be on y=0.

  • With a polygon, you're limited to 64 points (see the api doc) so that would explain why the right side isn't filled.  You might have 64 points at that time.

  • Hi, I'm intending to draw the line in a different color than the poly fill - that is why I'm creating a chart-line and a polygon.

  • Oh I see - I thought I had only 53 points (50 points + 3 for closing the polygon). But I created a custom Class Geo.Line

    and oversaw that I'm adding duplicate coordinates to the polygon. Thanks

  • Fair enough. Just keep trying.

    Like I said, for my scenario I just have it a little simpler than in yours and it works.

  • With the 1 to 50 loop, and then drawing, maybe doing two loops and drawing after each one...

    for i=1 to 24, draw that, and then

    for i=25 to 49 and then draw that.

  • Now it is working. The code needs some refactoring - especially I should set the initial size of the array or the pointers to the values are getting copied every time I'm adding an element - if it's not a linked list internally (I need to check on this). The updated code:

      function draw(dc) {
        var fillPolygonCoordinates = [];
        fillPolygonCoordinates.add([minX, minY]);
        var linesToDraw = [];
        
         // construct and draw lines
        for(var i=1; i < 50; ++i) {
          var x1 = minX + xAxis.getLengthInPixels() * ((i - 1) / 50.0d);                  
          var x2 = minX + xAxis.getLengthInPixels() * (i / 50.0d);
                
          var y1 = yRelativePixels[i-1];
          var y2 = yRelativePixels[i];
                                 
          var point1 = new Geo.Point(x1, y1);
          var point2 = new Geo.Point(x2, y2);
          var line = new Geo.Line(point1, point2);    
          linesToDraw.add(line);
          if(fillPolygonCoordinates.size() == 0) {
            fillPolygonCoordinates.addAll([[x1, y1], [x2, y2]]);
          } else {
              fillPolygonCoordinates.add([x2, y2]);
          }
         
        }
        
        fillPolygonCoordinates.addAll([[maxX, minY], [minX, minY]]);
        dc.setColor(Graphics.COLOR_GREEN, Graphics.COLOR_GREEN);
        dc.fillPolygon(fillPolygonCoordinates);
        dc.setColor(Graphics.COLOR_BLACK, Graphics.COLOR_BLACK);
        for(var i=0; i < linesToDraw.size(); ++ i) {
           linesToDraw[i].draw(dc);
        }
      }

  • I just checked out your widget TidalFlow. Are you using cubic interpolation for your charts or do you have so many datapoints?

  • I have enough datapoints, but would like to follow a cheaper approach like interpolation later.

    Well done, glad you got it sorted out. It looks good!

  • When you do an add() to an array, the VM grabs memory for the new size, copies over the old data, and then frees the old memory, so yes, that can be a real issue with large arrays, especially if you get tight on memory.  It's best to make an array it's max size and then work with that by keeping an index to the last valid value or something.