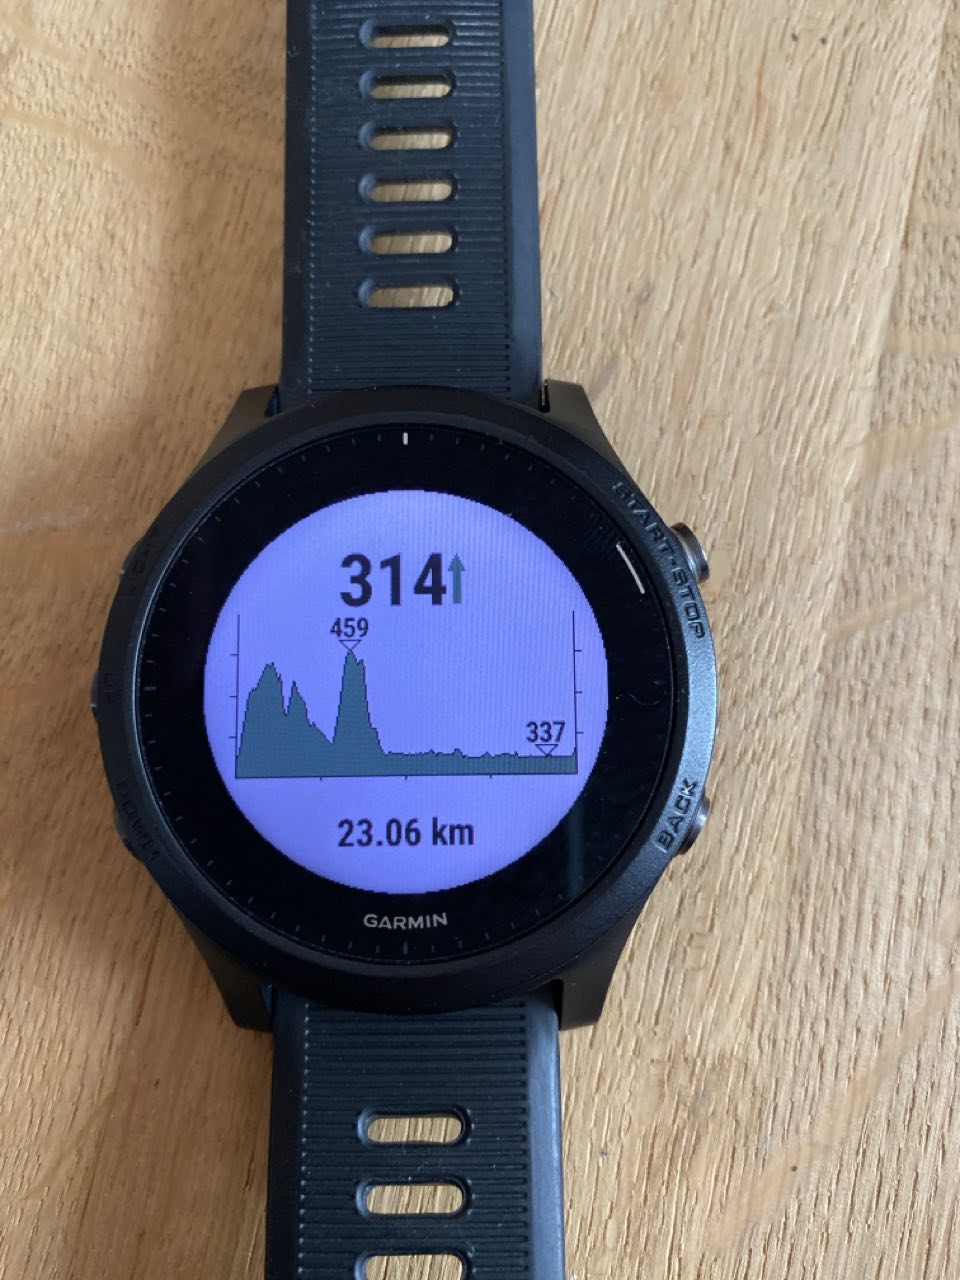
There's no standard class, but it's not hard to do your own.
Once you have all the values, you just use those along with something like drawLine to draw the bars, maybe using the min and max values to determine the height in pixels.
Say you have 150 pixels in height to work with and the values are between 30 and 60 and for a value of 45, it would be 75 pixels high.
Ty - just wanted to make sure that I'm not missing out on something. I will create a "streaming" chart which updates the chart when adding new data points. Maybe I will share that with an open source license.