This discussion has been locked.
You can no longer post new replies to this discussion. If you have a question you can start a new discussion

Compare OHR and chest strap HR values of an activity in Garmin Connect

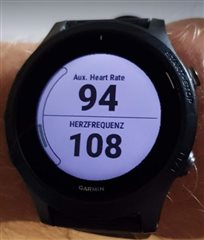
Now the DataField “Auxiliary Heart Rate” is available in the Forerunner 945 Garmin Connect Store.

The data field write in the fit file. “Heart Rate” contain the OHR and “Auxiliary Heart Rate” the chest strap. For all the statistics from an activity like Training Effect, Training Load, Training Focus, Recovery Time, … I would prefer the opposite but this seems to be not possible for the developer.

After opening the activity in Garmin Connect I can do now an overlap of “Heart Rate” and “Auxiliary Heart Rate”.

Especially for cycling it looks very bad for me. That was already clear for me, but now I have the real data.

Now I can also try to improve how I wear my watch to get less differences. Any hints?

What is your experience? Can I trust at minimum the resting heart rate I get in the morning, or is even this OHR value wrong?

  • In my experience the OHR gets morning HR correctly, but that might not be the case for everyone.

    Did you notice that the two HR graphs have two different X-axes whose ticks may vary depending on the minimum and maximum values? That can make the graph be completely useless...

  • Yes, you are right the Y-Axes have different scalings, because OHR and ChestStrap has different Max values during the activity. Especially the OHR jumps up very high when I stand up from a stair/bed.

    But I do not know how I can compare the two sensors faster. In GC I can see straight ahead the average and max value of both after the activity. After overlay of the 2 I can compare every point in time by clicking with with the mouse (web version) or taping with the finger (app) on the screen (even when y-axe scaling is different).

    During the activity itself I have defined a screen with the 2 values on it, to compare them during action.

  • My first experiences:

    - RHR (40-45) and HR in the night seems to work quite good. It is correct for me. Last night I was going in bed with my chest strap. Average values are the same, and the graph form is very similar.

    - Sitting on a chair and standing up. OHR is very bad for me! Jumps up much to high (110bpm instead of 80)) and goes down much too late.

    - I do a lot easy cycling when commuting to work (2x 25km with normal average 100bpm). With the OHR I have a 30bpm higher average than with chest strap (130bpm instead of 100). This destroy all my Firstbeat stats, because Training Effect raise from 0,1 to 3 ,Training Load raise from 3 to 130, recovery time from 0 to 30h. All this makes my Training Status and Training Focus become completely nonsense.

    Does OHR not like than I tense my muscles below the OHR to hold and turn my bike handlebars?

  • My first experience 20km … no so bad. The beginning is often the hard work of learning... In the end some variations to look the speed of ohr...pleasantly surprised...

    Ohr for me work fine for light works.

    PS FW 2.80

  • Thanks for the nice plot to domengo. OHR works obviously quite well for running & sleeping & meditation. You should not switch fast between 50 and 100 bpm as done during daily life motion.

    It is apparently not possible in GarminConnect to change the Y-Axis scaling later to compare the two HR values easier.

    One possibility to overcome this seems to push 1x in the activity very hard (high HR for both sensors) to get the chance to have the same Y-Axis scaling for both sensors in GC (as domengo has done).

    Any better hints for scaling the Y-Axis, which are easy and fast to use?

  • I couldn't find a way to adjust the axes on GarminConnect. What I did is extract the data from the FIT file myself and plot the graph using Excel. Have a look here.

    If you need help to plot - let me know.

  • First successful capture of a 27km bike ride with correct Y-axis scaling. Result much better as expected and what I have seen I the past. Average for both sensors is 120bpm. Watch was so tight that I have a mark from the OHR on my arm. Surprised about TE Anaerob of 1.1. With chest strap, I normally get for such a ride a TE Anaerob of 0.0 as I was breathing the complete time by my nose.

  • Bike ride from toady with horrible OHR data. Polar H10 chest strap correlate very well to the effort I have done.  I experienced such cases in the past (without having hard data). HR average OHR: 134bpm Polar H10: 109bpm. Watch was a little bit more loose than yesterday, but still having the mark from the OHR on my arm. In such cases all statistics are wrong TE Aerob, Anerob, Trainig Load, Training status, Trainings balance, recovery time. Any idea why the OHR sensor sometimes work and sometimes not?

  • If the sensor works correctly...the only is it positioning or strenght in the wrist….try also the other wristRolling eyes….

  • OHR seems to be pretty bad for me atm... never used to have a lot of issues (especially with easy constant runs) but now it seems to report values 30+ bpm higher then in reality. Very annoying as it indeed messes up all other stats (also, as I;'m training for marathon based on zones this also messes up that area).

    I have a HRM run to compare with and especially for intervals I use that anyway, but I at least expected easy constant pace runs to be not much of an issue.

    Experimenting with tightness, position, wrist, but haven't really found anything yet, Meh...