This discussion has been locked.
You can no longer post new replies to this discussion. If you have a question you can start a new discussion

UI Bug - The 7 day load displayed inconsistently

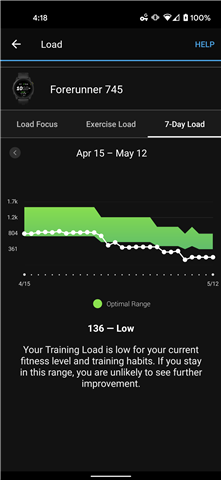
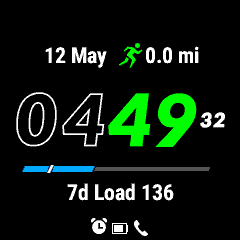
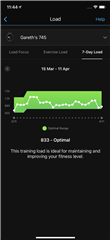
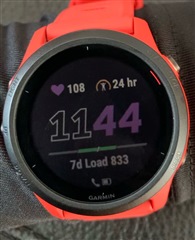
The 7 day load displayed on the watch face is inconsistent with the display in the connect app.  Within the connect app the green section indicates the Optimal range, and the white line indicates the actual training load.  It appear that on the 745 watch face these UI components are flipped, with the green bar changing based upon current load, and the white line more closely reflecting the optimal training zone.

For example in the following images you can see that, before a workout this morning, my training load is at the bottom of the optimal zone (according to connect), but the watch show the white line at the top of the green zone.


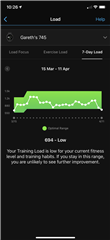
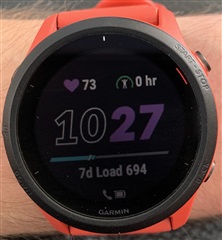
Post workout, it looks somewhat more sensible, but the white line being completely in the center of the green is inconsistent with the display in connect:

To be useful the watch display should really reflect the UI from the connect app, the green bar should increase and decrease based upon the optimum range (higher if I'm ready for more training at the moment, and lower if I should be taking it easier), while the white bar should reflect the current 7 day load relative to that optimum range.

If these items are not intended to be consistent then can I suggest that the labels and UI elements be revised so that it is clear that these are trying to represent different things?

ps - I suspect the reason this hasn't been raised previously is because this display element only appears to be available on the 745, and for most people (myself included) the majority of the time the display simply has a white line inside a green bar so it looks kinda similar, even if it isnt quite working consistently.

many thanks

Gareth

  • I've noticed the same behavior and wondered if it was a bug or if I just wasn't interpreting the bar correctly. I didn't see Ray mention any inconsistencies with the load display in his 745 review update (https://www.dcrainmaker.com/2021/04/garmin-forerunner-745-review-update-8-months-later.html), but he also doesn't show the load in Garmin Connect so it's hard to say if he sees it too.

    It would be great to get a response that either acknowledges the bug or explains why the watch face doesn't reflect the graph in Garmin Connect.

    Shea

  • Now that you mention it, the watch face is confusing the heck out of me. So here's another vote for fixing (or at least explaining) the watch face, because I don't really understand it.

    See screenshot below. My training load is a number (405), so how can it be represented by a horizontal bar on the watch face? What does the length of the bar represent? And the "optimal range" is a range, so how can it be represented by a single white line?

  • Here's another screenshot to illustrate the confusion. My actual load is outside of my optimum range in Garmin Connect, but the watch face shows them overlapping.

    7-DayLoadWatchFace

  • Hrm... Could it be that the horizontal bar is just divided into fixed thirds?

    Blue = low, Green = Optimal, Red = High

    If that's the case, the width of the colored bar never changes. And the white tick mark indicates your training load. If you're in the optimal range, the tick mark will be somewhere in the middle (green) third.

  • The watch is showing exactly what it should show. In your first picture the little diagonal white line is at the far right of the BLUE horizontal line which represents the recovery status (under the optimal load zone). That is exactly where I would expect the little diagonal white line to be considering that Garmin Connect shows your current load at the bottom of the optimal load zone. In your second picture the little diagonal white line is in the middle of the GREEN horizontal line which represents the productive status (within the optimal load zone) even though Garmin Connect shows your current load closer to the bottom of the optimal load zone. But that is simply because of the UI limitations linked to the small watch screen. There are probably not an infinite number of possible positions for the little horizontal white line in the watchface widget.  

  • After moving through the whole range of detraining, unproductive, recovery,  maintaining, productive, peaking, and overreaching this does appear to be the answer/fit with my observations.

    Even though we've figured it out here on the forums, I still think an official explanation would be nice in the documentation.