Training load still seems buggy in current version

Hello,

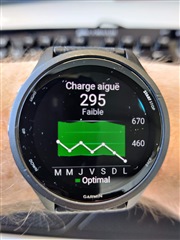
I cycled 4 times last week, giving it everything I had. The last race was even the Mont Ventoux climb and I gave it everything I had, not even being able to walk after the race. And my average training load has continued to fall.
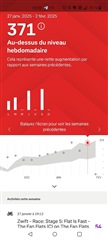
When I look at my strava activity summary, the intensity of my activities only increases from week to week. But on Garmin it's dropping and I'm even below the green zone now.
Is this normal?
Am I the only one who feels there's a problem?

This is my Garmin Training load : 
This is what I have in Strava : 
  • are you looking at the training load in each activity? contact Garmin support for help

  • It's the global training load. I don't have a training load by activity. For each activity I have the Training Effect and the exercice load. But the training load is an overall statistic.

    And about Exercice Load, compared to strava I have :

    * La Reine : 113 (126 for strava)

    * Lutscher : 114 (114 for strava too)

    * Petite douleur : 80 (75 for strava)

    * The fan flats : 94 (54 for strava)

    So I really don't understand why the Strava load graph is raising (Which is normal, given that I did a lot more exercise that week) and not the Garming load graph