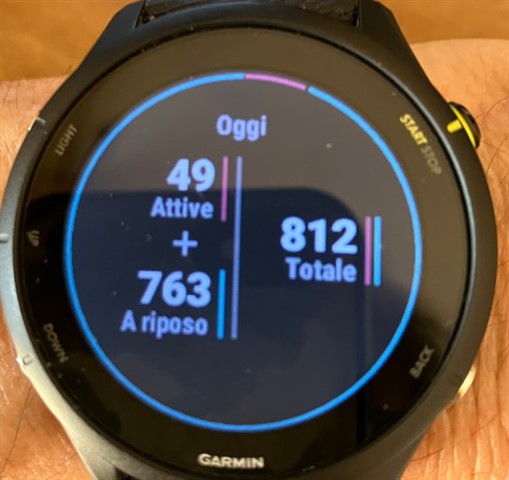
Hi all, in the image "Calories 1" I see today's at 10am calories: active 49, resting 763, total 812, the forecasted total for today is 1887.
Now, in the image "Calories 2" I do not understand the graph: the first line from the bottom should value 750, but I see the blue box just below 750 and not upper as it should be, as it's 763.
and, what represent the red peaks?
If I have well understood the scale should be x100 calories.
thanks for any feedbacks