Here are results from my first experiment to see how long my FR255 battery could stretch. I ended about 4 hours short of 20 days to take a final screenshot of the Battery Gauge. I wasn't sure I'd have time to do it later but still before it ran out of power.
Here's an overview of what I tested:
- First two days had wrist-based HR disabled and also no positioning systems. So only step tracking and barometric altimeter were used.
- For the rest of the time, I had wrist-based HR enabled and wearing it 24x7 with sleep tracking.
- I never used the "power saving" mode. But I use a CIQ watchface that does not display seconds or any rapid metrics like HR.
- I never enabled the pulse-ox sensor during the whole period.
- I marked roughly 1-hour activities on the battery plot, colored by which tracking mode was enabled.
- I had one unusual day where I did a "GPS soak" for about an hour while trying to understand missing ephemeris data.
- I only enabled the bluetooth phone connection for a few minutes per day to sync activity data to GCM.
- But on the day with the GPS soak, I also had the phone connection open for an hour or two to finally get updated ephemeris data.
Some observations on the battery life estimates:
- The Garmin estimates seem capped at 23 day/30 day for regular/power saving modes. This was during the first few days when the indicated percentage dropped 2% and 3% per 24 hours with wrist-HR disabled. The Battery Gauge app made some overly optimistic estimates of 50-70 days on the same days.
- By the third day, the Garmin estimate converged with reality, estimating 17 days remaining and decreasing 1 day every 24 hours. It was showing 13 hours remaining with an indicated 3% battery remaining.
- The Battery Gauge app was always estimating a longer life that was slowing converging towards the Garmin estimate. On the nineteenth day it finally dropped to estimating 20 days of life for a full charge.
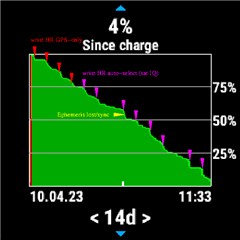
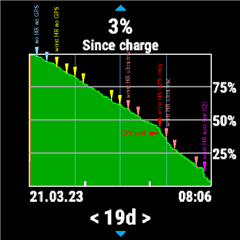
Now the annotated battery graph.
- light blue activities are with wrist-HR disabled and satellite tracking disabled
- yellow activities are with wrist-HR enabled and satellite tracking disabled
- orange activities are with HR enabled and UltraTrac satellite mode
- red activity and GPS soak were with HR enabled and GPS-only mode
- magenta activity was with HR enabled and auto-select (SatIQ) mode
The vertical lines are my attempt to break the timeline up into 5 day chunks. The plotted period is a few hours shy of 20 days.
As you can see, the graph looks to have strong linear trends. I think the reported "percent" is a little bit wonky on the first and last days at the very extremes, but I am impressed that it behaves as consistently as it did. I am assuming it is just monitoring battery voltage and not integrating any real current/power draw measures.
If you tried to draw a line from the top corner through the first yellow tic, you might extrapolate a trend-line for using the watch as just a step tracker (no HR and no GPS). I turned on the HR function at the same time I did that first yellow activity. I wasn't patient enough to keep using it without sleep tracking to get a longer-term average of this power mode.
2023-04-24: Adding another full discharge cycle. This time using a mixture of GPS-only and auto-select (SatIQ) modes. These are 1 hour activities so 12 hours of satellite tracking spread across 14 days. Right in the middle, I encountered a slow satellite fix and discovered my watch was showing "Ephemeris: missing" again, and did a prolonged sequence of phone syncs and test activities to get it to show "Ephemeris: current" again.